Hello!
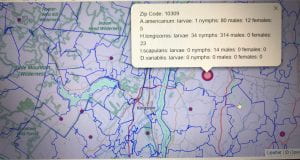
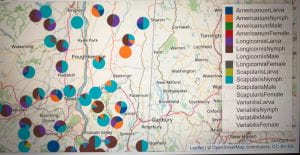
When I posted last week, I mentioned that most of my work has been web based. Now, my primary focus is completing the map to be displayed on the Tick Blitz website. I’ve been working on aggregating the data so that the number of ticks is displayed for each zip code. I’ve been working on a few options for the maps. One displays a circle, where the size of the circle corresponds to the number of ticks found. Another displays a pie chart in the center of each zip code, categorized by the species of tick.