Cancer cells shed vesicles via processes that differ significantly from normal cellular processes. We are currently studying means for isolating and characterizing these microvesicles by microfluidic devices, and investigating the biological processes that underpin their secretion, uptake, and signaling function.
A selection of figures from relevant publications are below. Click to open a carousel view. Links to the original manuscript are in the captions.
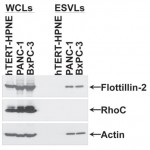
Figure 2. Immunoblot Assay. Serum-starved hTERT-HPNE, PANC-
1 and BxPC-3 cells were lysed, and the ESVs shed into the medium
by the cells were isolated and lysed as well. The whole cell lysates
(WCLs) and the ESV lysates (ESVLs) were subjected to western blot
analysis with antibodies against the ESV marker flotillin-2, the
cytosolic-specific marker RhoC and the loading control actin. Two
blank channels separate WCLs and ESVLs. doipdf
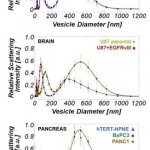
Figure 1. Dynamic light scattering measurements reveal a bimodal
vesicle population among cancer cell types examined. (a) ESV size
distribution in MDAMB231 cell lines. MDAMB231 peaks are
located at 73 +/- 1 nm and 413 +/- 4 nm. (b) ESV size distribution in
U87 and U87+EGFRvIII cell lines. U87 peaks are located at
120 +/- 1 nm and 525 +/- 5 nm. U87+EGFRvIII peaks are located at
70 +/- 3 nm and 378 +/- 2 nm. (c) ESV size distribution in PANC-1,
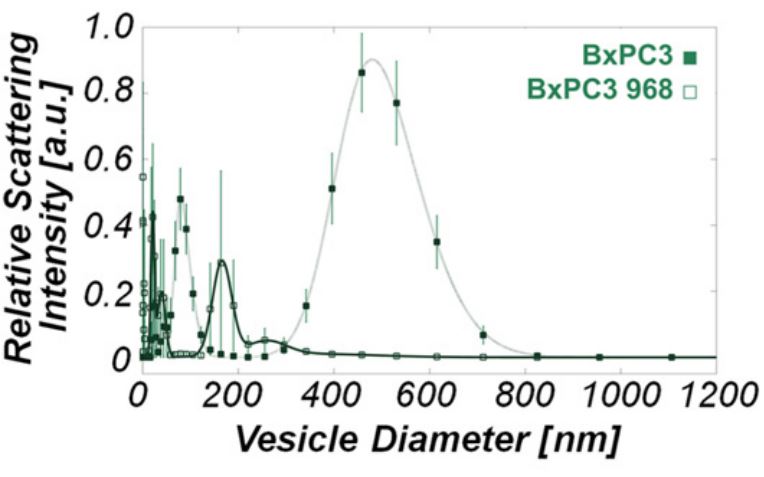
BxPC-3 and hTERT-HPNE cell lines. The PANC-1 peaks
are located at 98 +/- 3 nm and 515 +/- 3 nm. The BxPC-3 peaks are
located at 80 +/- 1 nm and 480 +/- 2 nm. The hTERT-HPNE peaks are
located at 31 +/- 1 nm and 51 +/- 1 nm, and 417 +/- 11 nm. Of particular
interest is the striking difference in ESV signatures between the
normal pancreas cell line, hTERT-HPNE, and those of the two
pancreatic cancer lines, BxPC-3 and PANC-1. Peaks at approximately
30 nm for the brain, breast and BxPC-3 (pancreas) lines are
an artifact of the culture medium (RPMI-1640). All deviations from
the peak locations represent those values falling within the 95%
confidence interval predicted by nonlinear least squares regression. doipdf
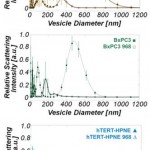
Figure 3. Dynamic light scattering measurements demonstrate that
treatment of cancer cells with compound 968 substantially reduces
large-diameter microvesicle production. (a) ESV size distribution in
untreated PANC-1 and 968-treated PANC-1 cells. (b) ESV
size distribution in BxPC-3 and 968-treated BxPC-3 (□) cells.
(c) ESV size distribution in hTERT-HPNE and 968-treated
hTERT-HPNE cells. doipdf
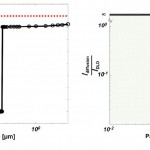
Fig. 2 Device Performance and Transport. a Calculated Displacement. b Transport Length Ratio. doi pdf
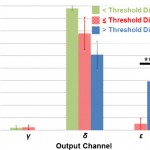
Fig. 3 In polystyrene bead separation experiments, the microfluidic
obstacle array preferentially deflects large-diameter particles in the
target output. doi pdf
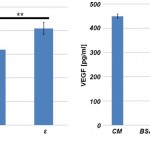
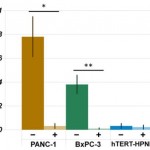
Figure 4. Total vesicle volume analysis demonstrates that treatment
of cancer cells with compound 968 dramatically reduces vesicle
production in cancer cells (PANC-1, *p = 0.0006; BxPC-3,
**p = 0.0002) and has no statistically significant effect on vesicle
production in normal epithelial cells (hTERT-HPNE, p = 0.7). doipdf