Analytical Chemistry, 2017: Separation of 300 and 100 nm Particles in Fabry−Perot Acoustofluidic Resonators
-
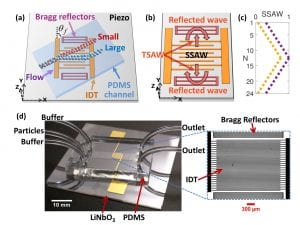
- Description of the Fabry-Perot acoustofluidic device. (a) Schematic of the device shows a binary mixture of small and large particles flow directly over the IDT region and spatially separate. (b) Schematic of the Bragg reflectors and the IDT system on a piezoelectric substrate shows the working principle of the Fabry-Perot cavity. (c) Illustrates the non-uniform SSAW field along the IDT finger-pairs (N) in the Fabry-Perot resonator (purple) and in the transducer without reflectors (yellow), estimated by the superposition from each finger-pair and without attenuation. The SSAW fields are normalized by the maximum of Fabry-Perot field (d) Shows image of the fabricated device and zoomed-in view of the Fabry-Perot assembly.
-
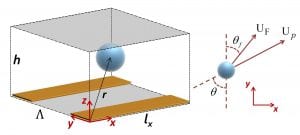
- A Unit cell, periodic in x and y directions, shows the domain for the analytical model of particle transport. The electrodes are shown in yellow and one unit cell encompasses half of each of the two electrodes, i.e. each with width λ/8. The particle is shown with the relative orientation of external velocity field U_F at angle θ_f with respect to the y axis. The particle migrates at angle θ with velocity U_p.
-
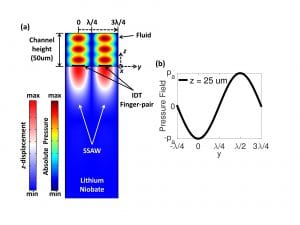
- Numerical finite element simulations of acoustic fields in the Fabry-Perot acoustofluidic device. (a) 2D frequency-domain analysis shows z-displacement field in lithium niobate and absolute pressure field in fluid for one finger-pair of the IDT. (b) Shows the sinusoidal variation of acoustic pressure field along the y direction at z=25 um, i.e. in the middle of the fluid channel.
-
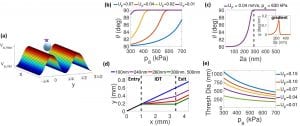
- Vector-chromatography-based analytical model for transport of submicron particles in the Fabry-Perot acoustofluidic device. (a) Shows the acoustic potential surface obtained from numerical analysis, and advection of a particle in it. The periodicity of the acoustic potential is λ/2. (b) Shows the influence of acoustic (p_a) and advection fields (U_F in mm/s) on the particle trajectory. (c) Shows the size-dependent migration of particles in a given advection and acoustic potential field. The dashed line indicates the threshold diameter (290 nm), which is chosen as size for which 〖θ>89.99〗^o. The inset shows the gradient g (deg/nm) of the theta–size curve with peak at 250 nm. (d) Shows average trajectories of the particles entering the IDT region at same location (black line) and separating into different streams at conditions from (c). (e) Shows that the threshold diameter can be tuned by controlling the external power (pressure amplitude p_a) and flow rate (flow velocity U_F). The unit of U_F is mm/s.
-

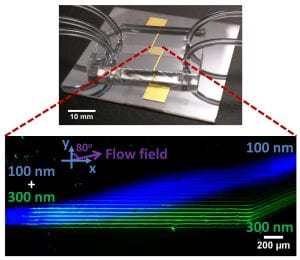
- Separation of submicron particles (a) Shows a mixture of 100-nm (blue) and 300-nm (green) polystyrene particles separating into two distinct populations in the device. 100-nm and 300-nm particles are imaged in different fluorescent-filter lines and overlaid on each other to produce intensity-enhanced and false color images for visualization. Sequences of images are captured, averaged, and background subtracted using average background image to generate the mean fluorescent image shown in (a). The red dashed window is analyzed to quantify the separation. (b) Shows the experimental (exp.) and theoretical (the.) mean intensity distribution along y-direction for each population. The experimental intensity distribution is obtained from (a) by averaging the intensity of each population along x-direction (40 pixels) in the given window and normalizing it by the corresponding maximum average intensity. A splitter (vertical dashed line in (b)) is assumed at y_s=395 um to quantify the separation efficiency. (c) Shows the separation efficiency of the mixture. The error bars denote standard deviation between different images that are used to obtain the mean image in (a). The power density and the input flow rate are 0.12 W/mm2 and 12.2 (Sheath- 6, particles- 0.2, Sheath -6) ul/min, respectively. The flow rate in each outlet is 6.1 ul/min.
-

- Comparison of the acoustic and the DEP effects on the particle trajectories. (a) Shows the mean fluorescent image of 500-nm (2.5% solids, Polysciences) particles in a glass DEP device. Total flow rate and peak-to-peak voltage (Vpp) are 6.5 (Sheath- 3, particles- 0.5, Sheath- 3) ul/min and 17.6 V, respectively. The flow rate in each outlet is 3.25 ul/min. (b) Shows the composite, false color, background-subtracted (in ImageJ with rolling ball radius = 494 um), and intensity-enhanced mean fluorescent image of 500-nm (yellow) and 100-nm (blue) particles in the Fabry-Perot device. Total flow rate and input power density are 12.2 (Sheath- 6, particles- 0.2, Sheath- 6) ul/min and 0.12 W/mm2 (Vpp =18.3 V), respectively. The flow rate in each outlet is 6.1 ul/min. Both devices are operated at 48.8 MHz.
-
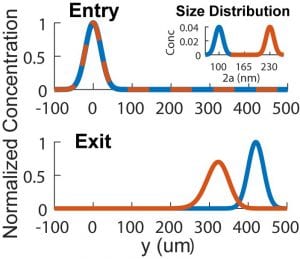
- Analytical transport of two sub-300 nm polystyrene populations. The inset shows mean sizes of 230-nm (orange) and 100-nm (blue) with the standard deviation of 10 nm. The Entry and Exit plots show y-distribution of the populations at the entry (mean=0, standard deviation = 20 um) and the exit of the IDT, respectively. The power density is 0.12 W/mm2 and the flow rate is 12.2 ul/min (i.e. p_a=3.07 MPa, U_F=1.2 mm/s). The threshold diameter is 290 nm.
Citation: Sehgal P, Kirby BJ. Separation of 300 and 100 nm Particles in Fabry−Perot Acoustofluidic Resonators, Analytical Chemistry, 89(22): pages 12192-12200. 10.1021/acs.analchem.7b02858 https://pubs.acs.org/doi/pdf/10.1021/acs.analchem.7b02858
Abstract: Separation of particles on the order of 100 nm with acoustophoresis has been challenging to date because of the competing natures of acoustic radiation force and acoustic streaming on the particles. In this work, we present a surface acoustic wave (SAW)-based device that integrates a Fabry-Perot type acoustic resonator into a microfluidic channel to separate submicron particles. This configuration enhances the overall acoustic radiation force on the particles and thereby offers controlled manipulation of particles as small as 300 nm. Additionally, SAW-based excitation generates high-frequency acoustic waves in the system relative to bulk acoustic wave (BAW)-based actuation, which suppresses Rayleigh streaming effects on the submicron particles. We demonstrate, for the first time, a continuous-flow acoustophoretic separation of 300-nm and 100-nm particles in our device with a separation efficiency of 86.3%. We also present an analytical stochastic method to model the transport of submicron particles in the device and predict the migration trajectories as a function of acoustic and velocity potential field strengths. Our model incorporates particle diffusion, which is important for small particles, and successfully predicts the size-dependent separation modality of our system. This device can be used for several applications in microfluidics that require sorting of the submicron particles, and the analytical method can also be extended to predict the particle transport in other systems.
Figures:
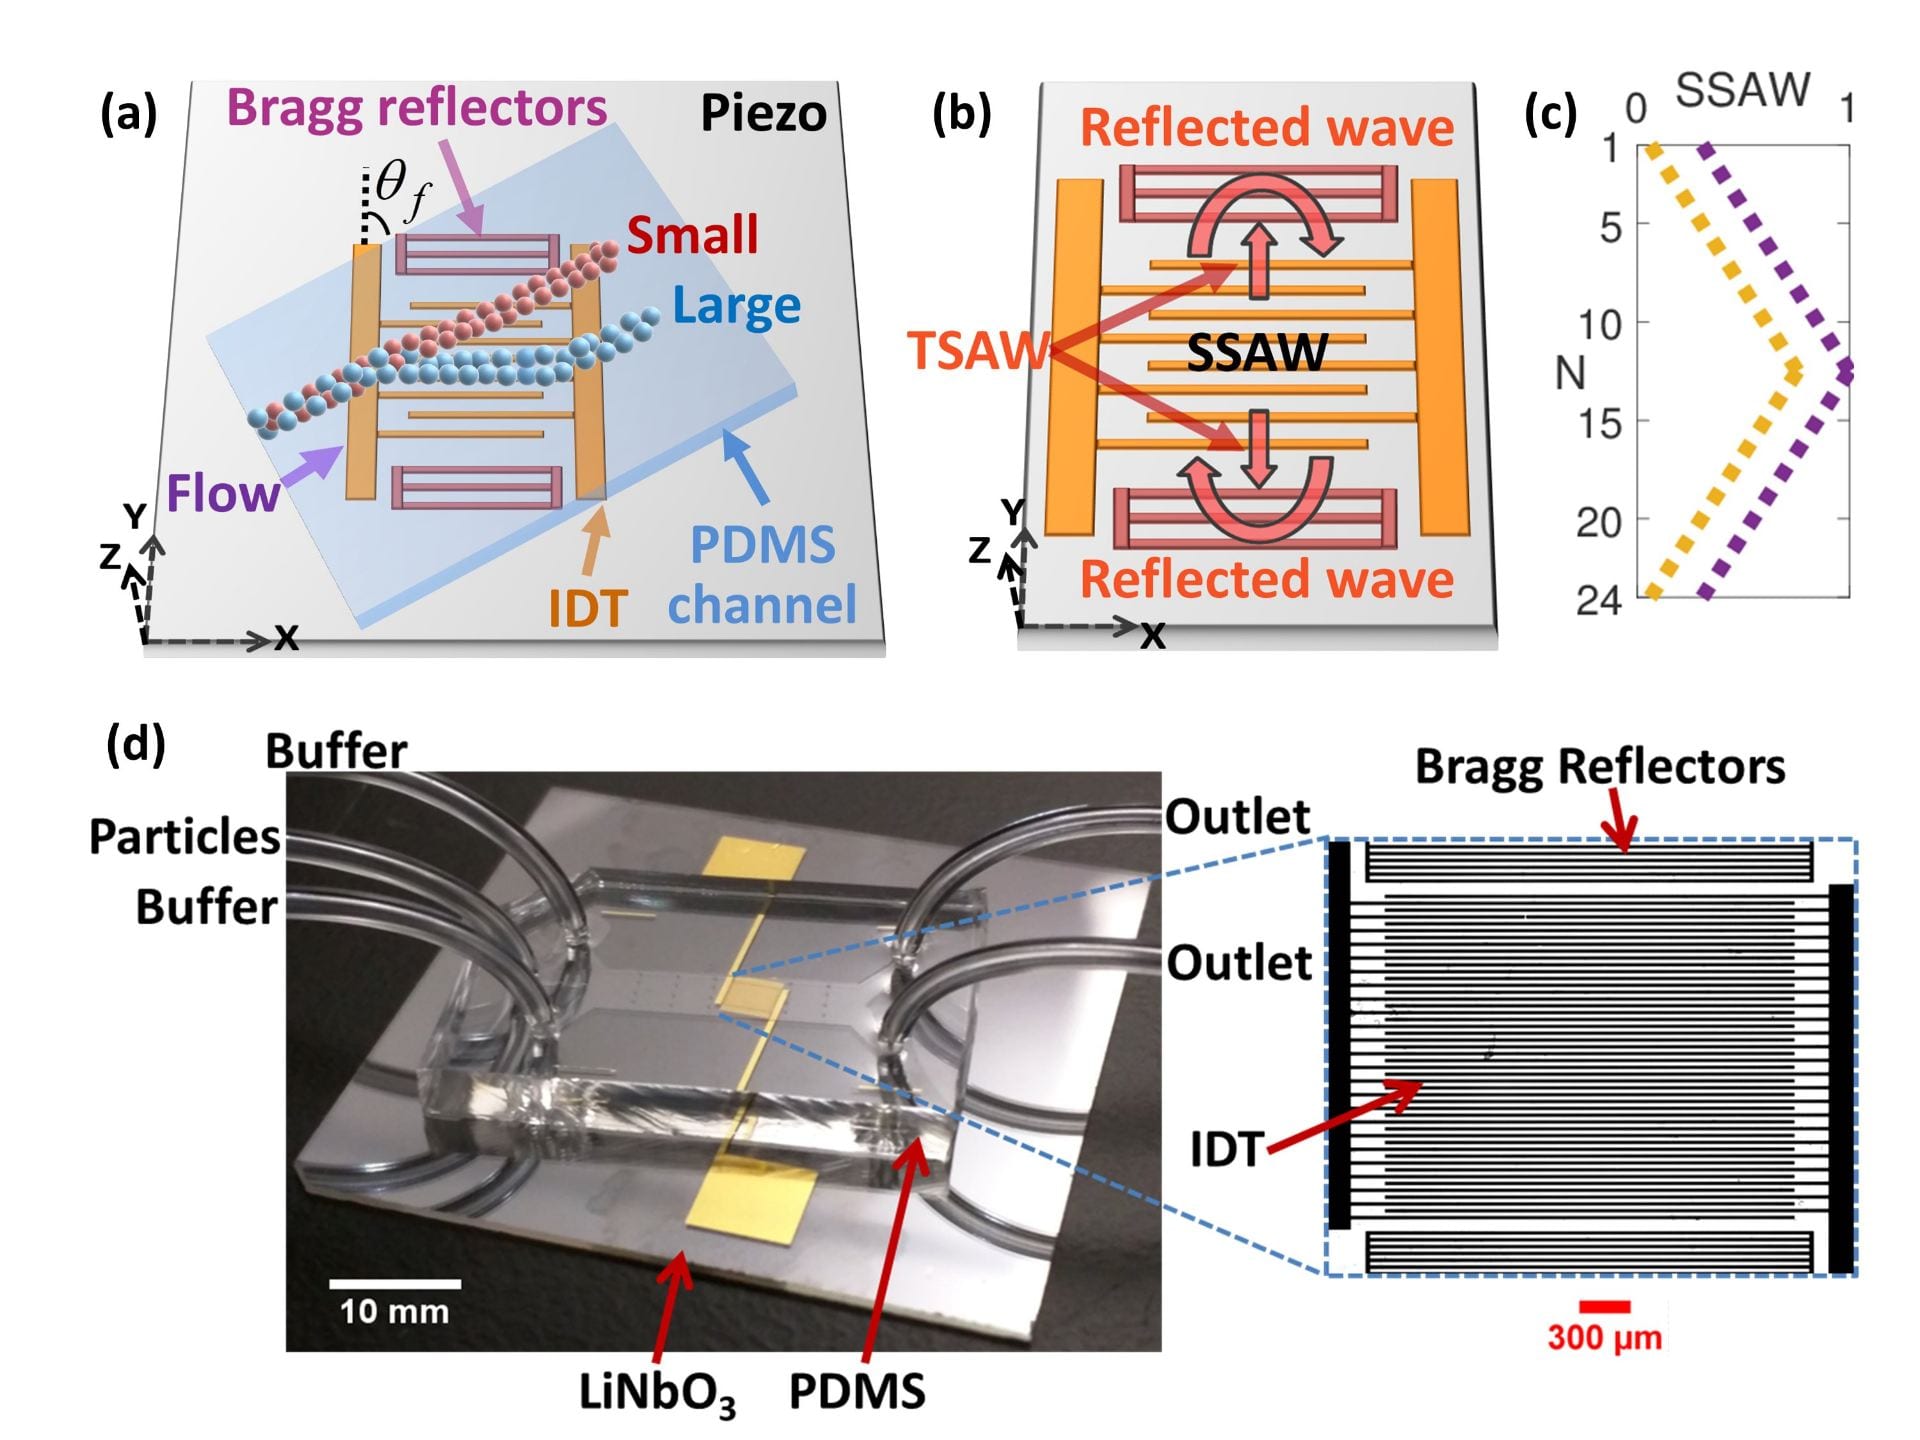
Figure 1. Description of the Fabry-Perot acoustofluidic device. (a) Schematic of the device shows a binary mixture of small and large particles flow directly over the IDT region and spatially separate. (b) Schematic of the Bragg reflectors and the IDT system on a piezoelectric substrate shows the working principle of the Fabry-Perot cavity. (c) Illustrates the non-uniform SSAW field along the IDT finger-pairs (N) in the Fabry-Perot resonator (purple) and in the transducer without reflectors (yellow), estimated by the superposition from each finger-pair and without attenuation. The SSAW fields are normalized by the maximum of Fabry-Perot field (d) Shows image of the fabricated device and zoomed-in view of the Fabry-Perot assembly.

Figure 2. A Unit cell, periodic in x and y directions, shows the domain for the analytical model of particle transport. The electrodes are shown in yellow and one unit cell encompasses half of each of the two electrodes, i.e. each with width λ/8. The particle is shown with the relative orientation of external velocity field U_F at angle θ_f with respect to the y axis. The particle migrates at angle θ with velocity U_p.
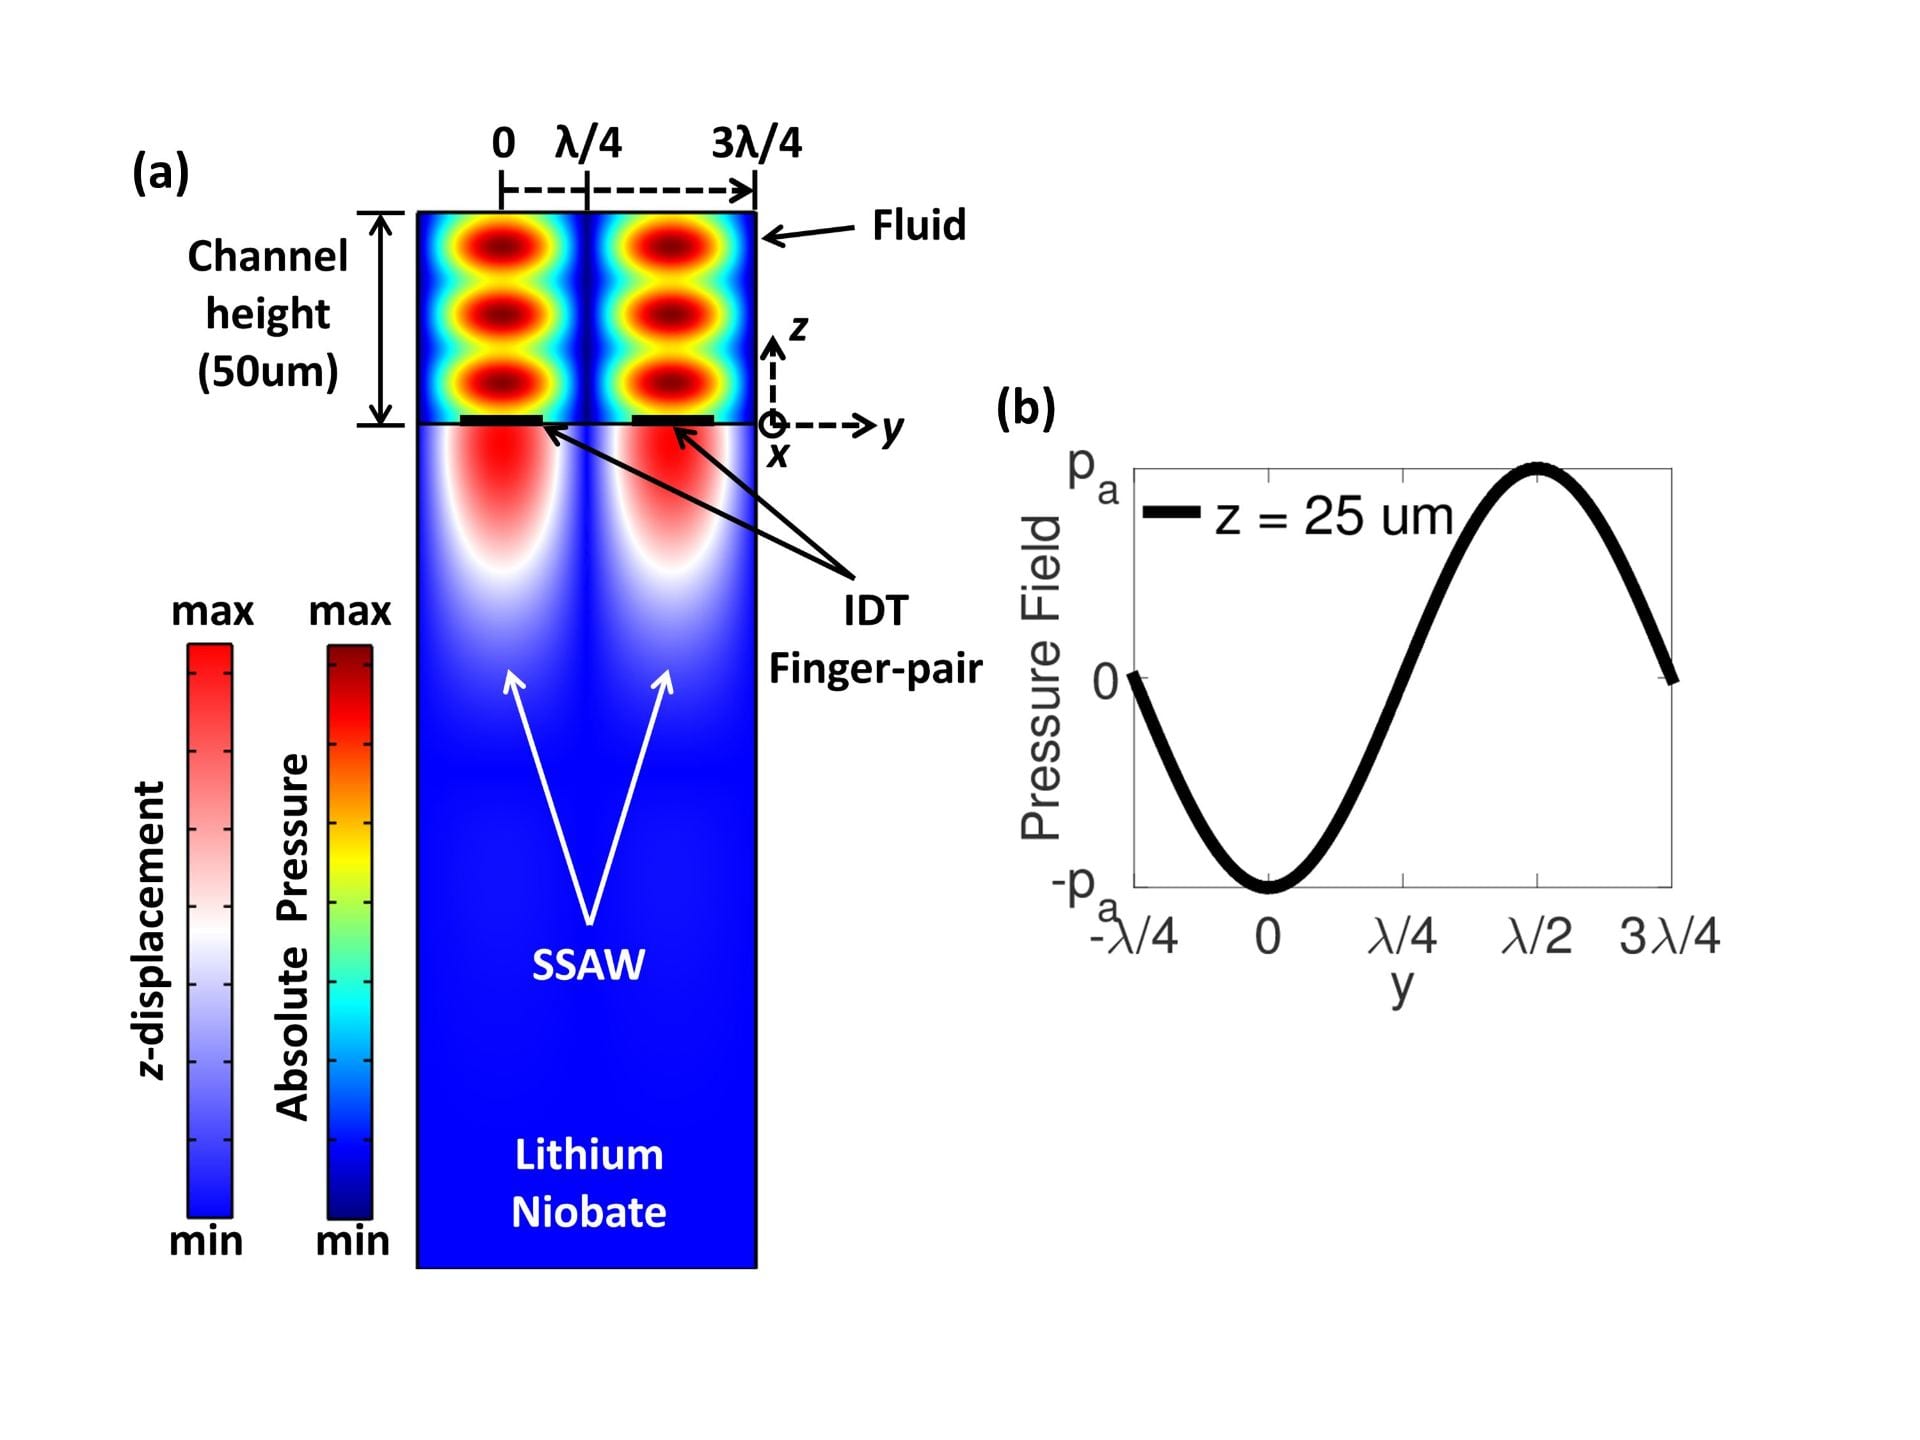
Figure 3. Numerical finite element simulations of acoustic fields in the Fabry-Perot acoustofluidic device. (a) 2D frequency-domain analysis shows z-displacement field in lithium niobate and absolute pressure field in fluid for one finger-pair of the IDT. (b) Shows the sinusoidal variation of acoustic pressure field along the y direction at z=25 um, i.e. in the middle of the fluid channel.
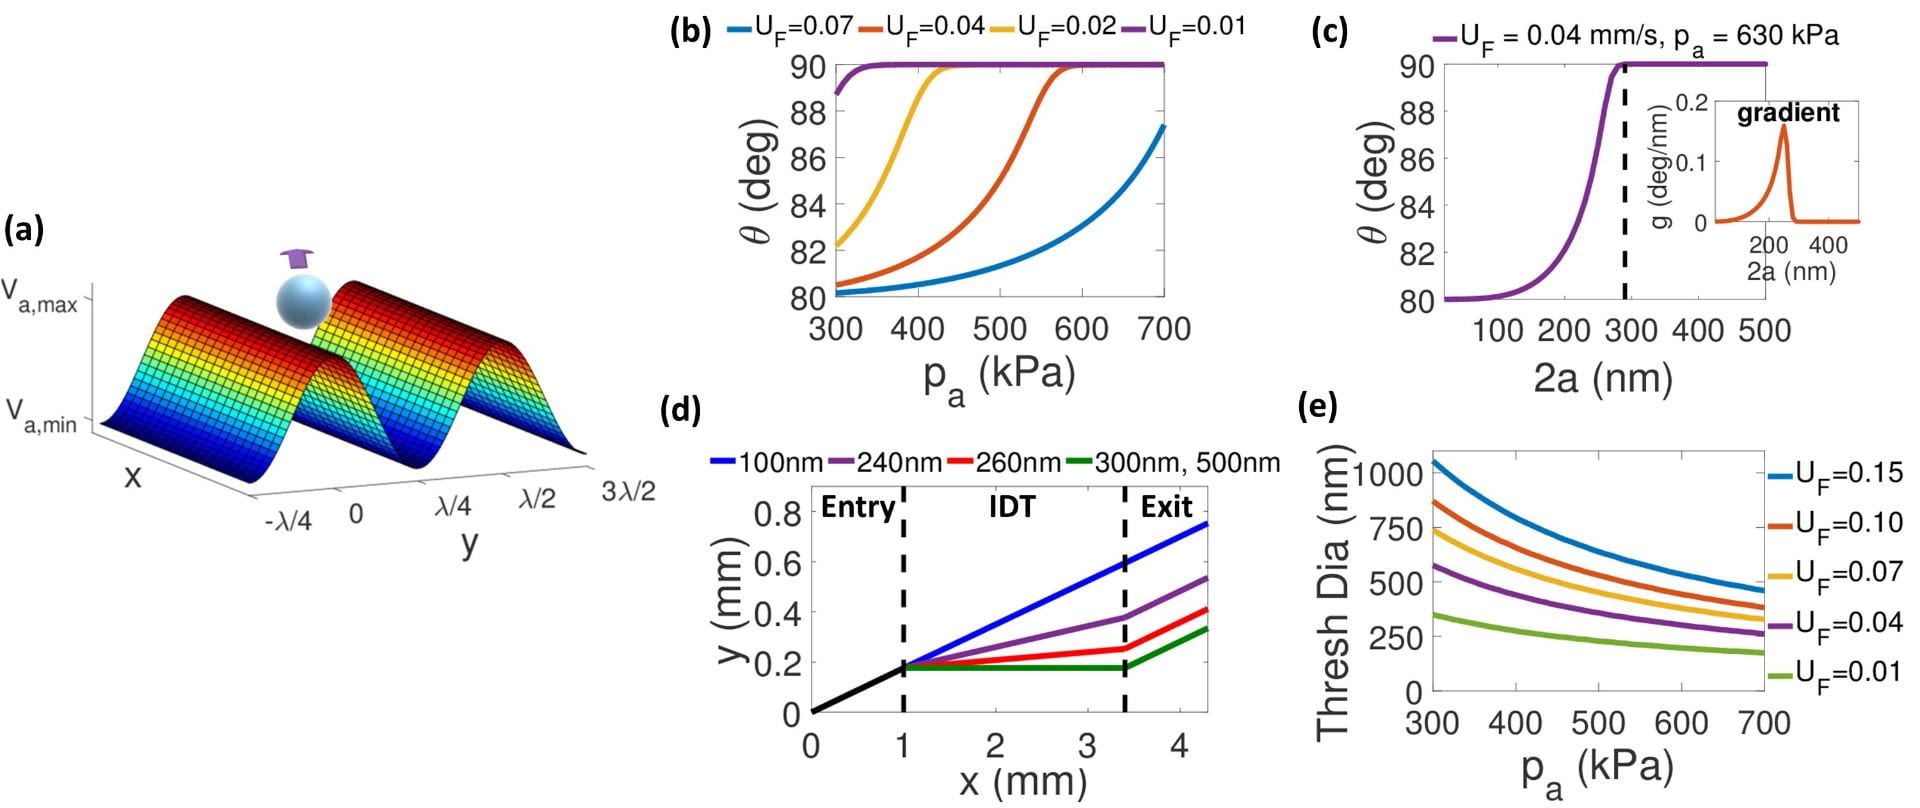
Figure 4. Vector-chromatography-based analytical model for transport of submicron particles in the Fabry-Perot acoustofluidic device. (a) Shows the acoustic potential surface obtained from numerical analysis, and advection of a particle in it. The periodicity of the acoustic potential is λ/2. (b) Shows the influence of acoustic (p_a) and advection fields (U_F in mm/s) on the particle trajectory. (c) Shows the size-dependent migration of particles in a given advection and acoustic potential field. The dashed line indicates the threshold diameter (290 nm), which is chosen as size for which 〖θ>89.99〗^o. The inset shows the gradient g (deg/nm) of the theta–size curve with peak at 250 nm. (d) Shows average trajectories of the particles entering the IDT region at same location (black line) and separating into different streams at conditions from (c). (e) Shows that the threshold diameter can be tuned by controlling the external power (pressure amplitude p_a) and flow rate (flow velocity U_F). The unit of U_F is mm/s.
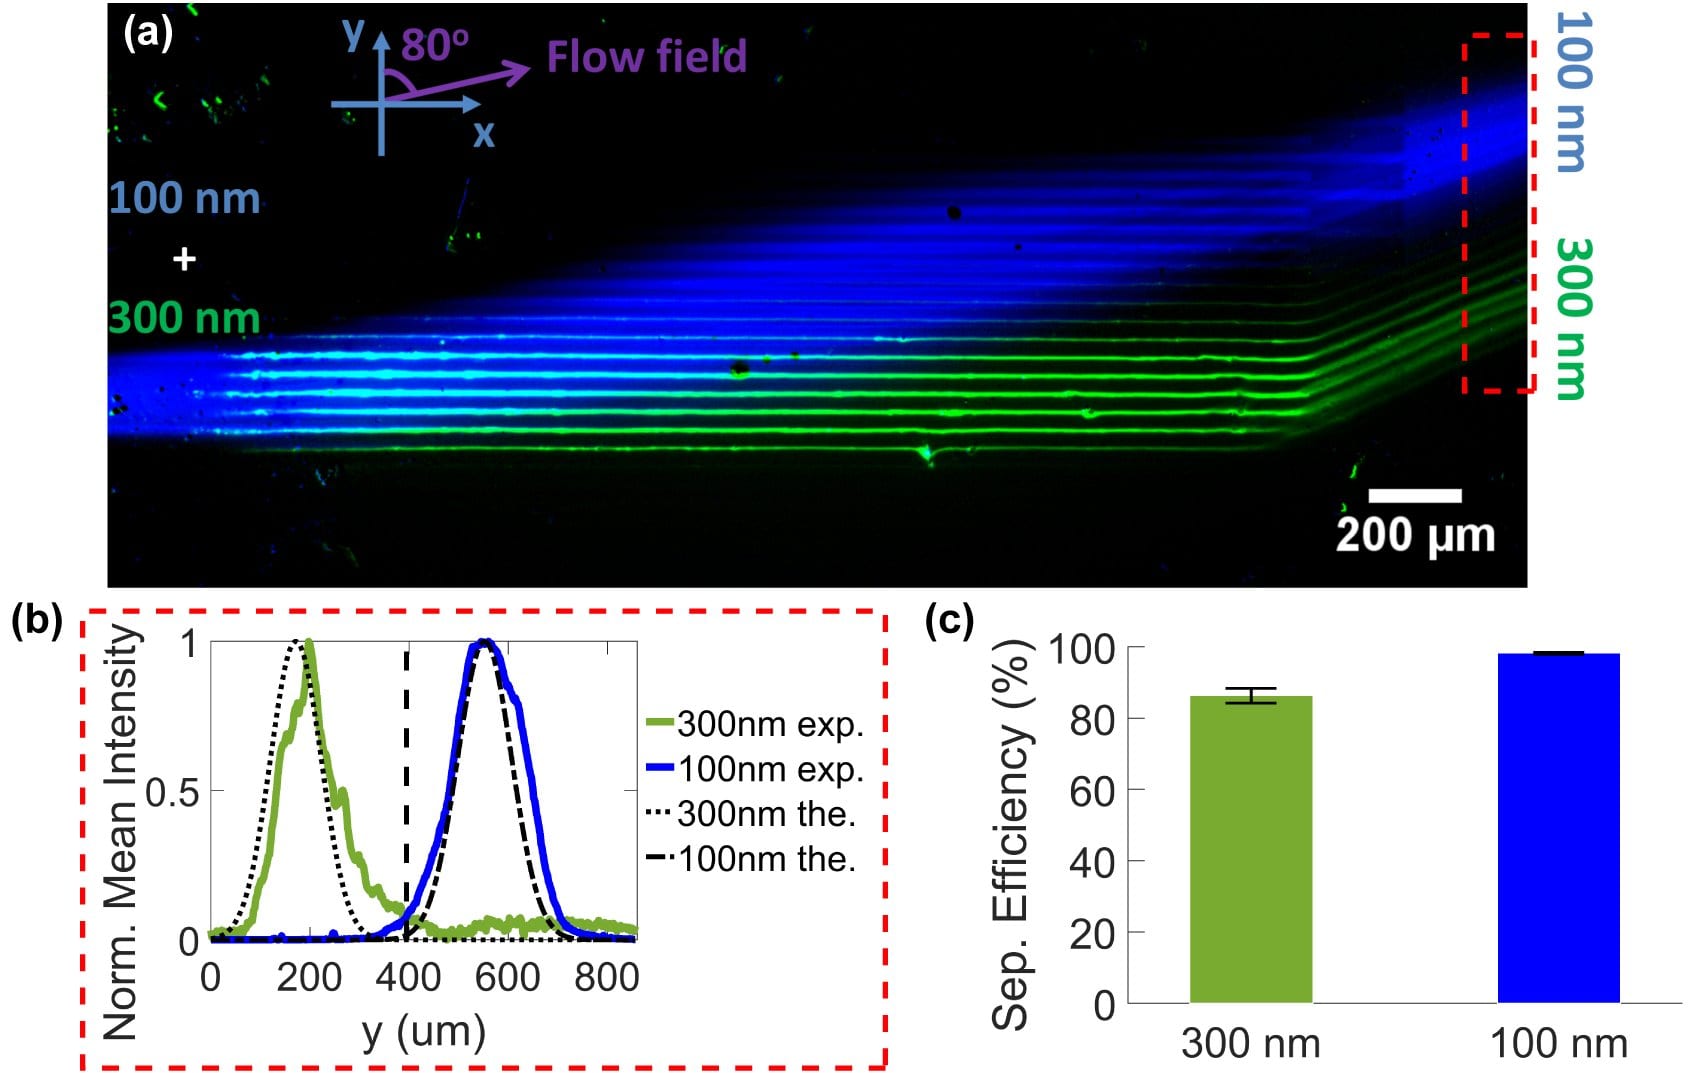
Figure 5. Separation of submicron particles (a) Shows a mixture of 100-nm (blue) and 300-nm (green) polystyrene particles separating into two distinct populations in the device. 100-nm and 300-nm particles are imaged in different fluorescent-filter lines and overlaid on each other to produce intensity-enhanced and false color images for visualization. Sequences of images are captured, averaged, and background subtracted using average background image to generate the mean fluorescent image shown in (a). The red dashed window is analyzed to quantify the separation. (b) Shows the experimental (exp.) and theoretical (the.) mean intensity distribution along y-direction for each population. The experimental intensity distribution is obtained from (a) by averaging the intensity of each population along x-direction (40 pixels) in the given window and normalizing it by the corresponding maximum average intensity. A splitter (vertical dashed line in (b)) is assumed at y_s=395 um to quantify the separation efficiency. (c) Shows the separation efficiency of the mixture. The error bars denote standard deviation between different images that are used to obtain the mean image in (a). The power density and the input flow rate are 0.12 W/mm2 and 12.2 (Sheath- 6, particles- 0.2, Sheath -6) ul/min, respectively. The flow rate in each outlet is 6.1 ul/min.
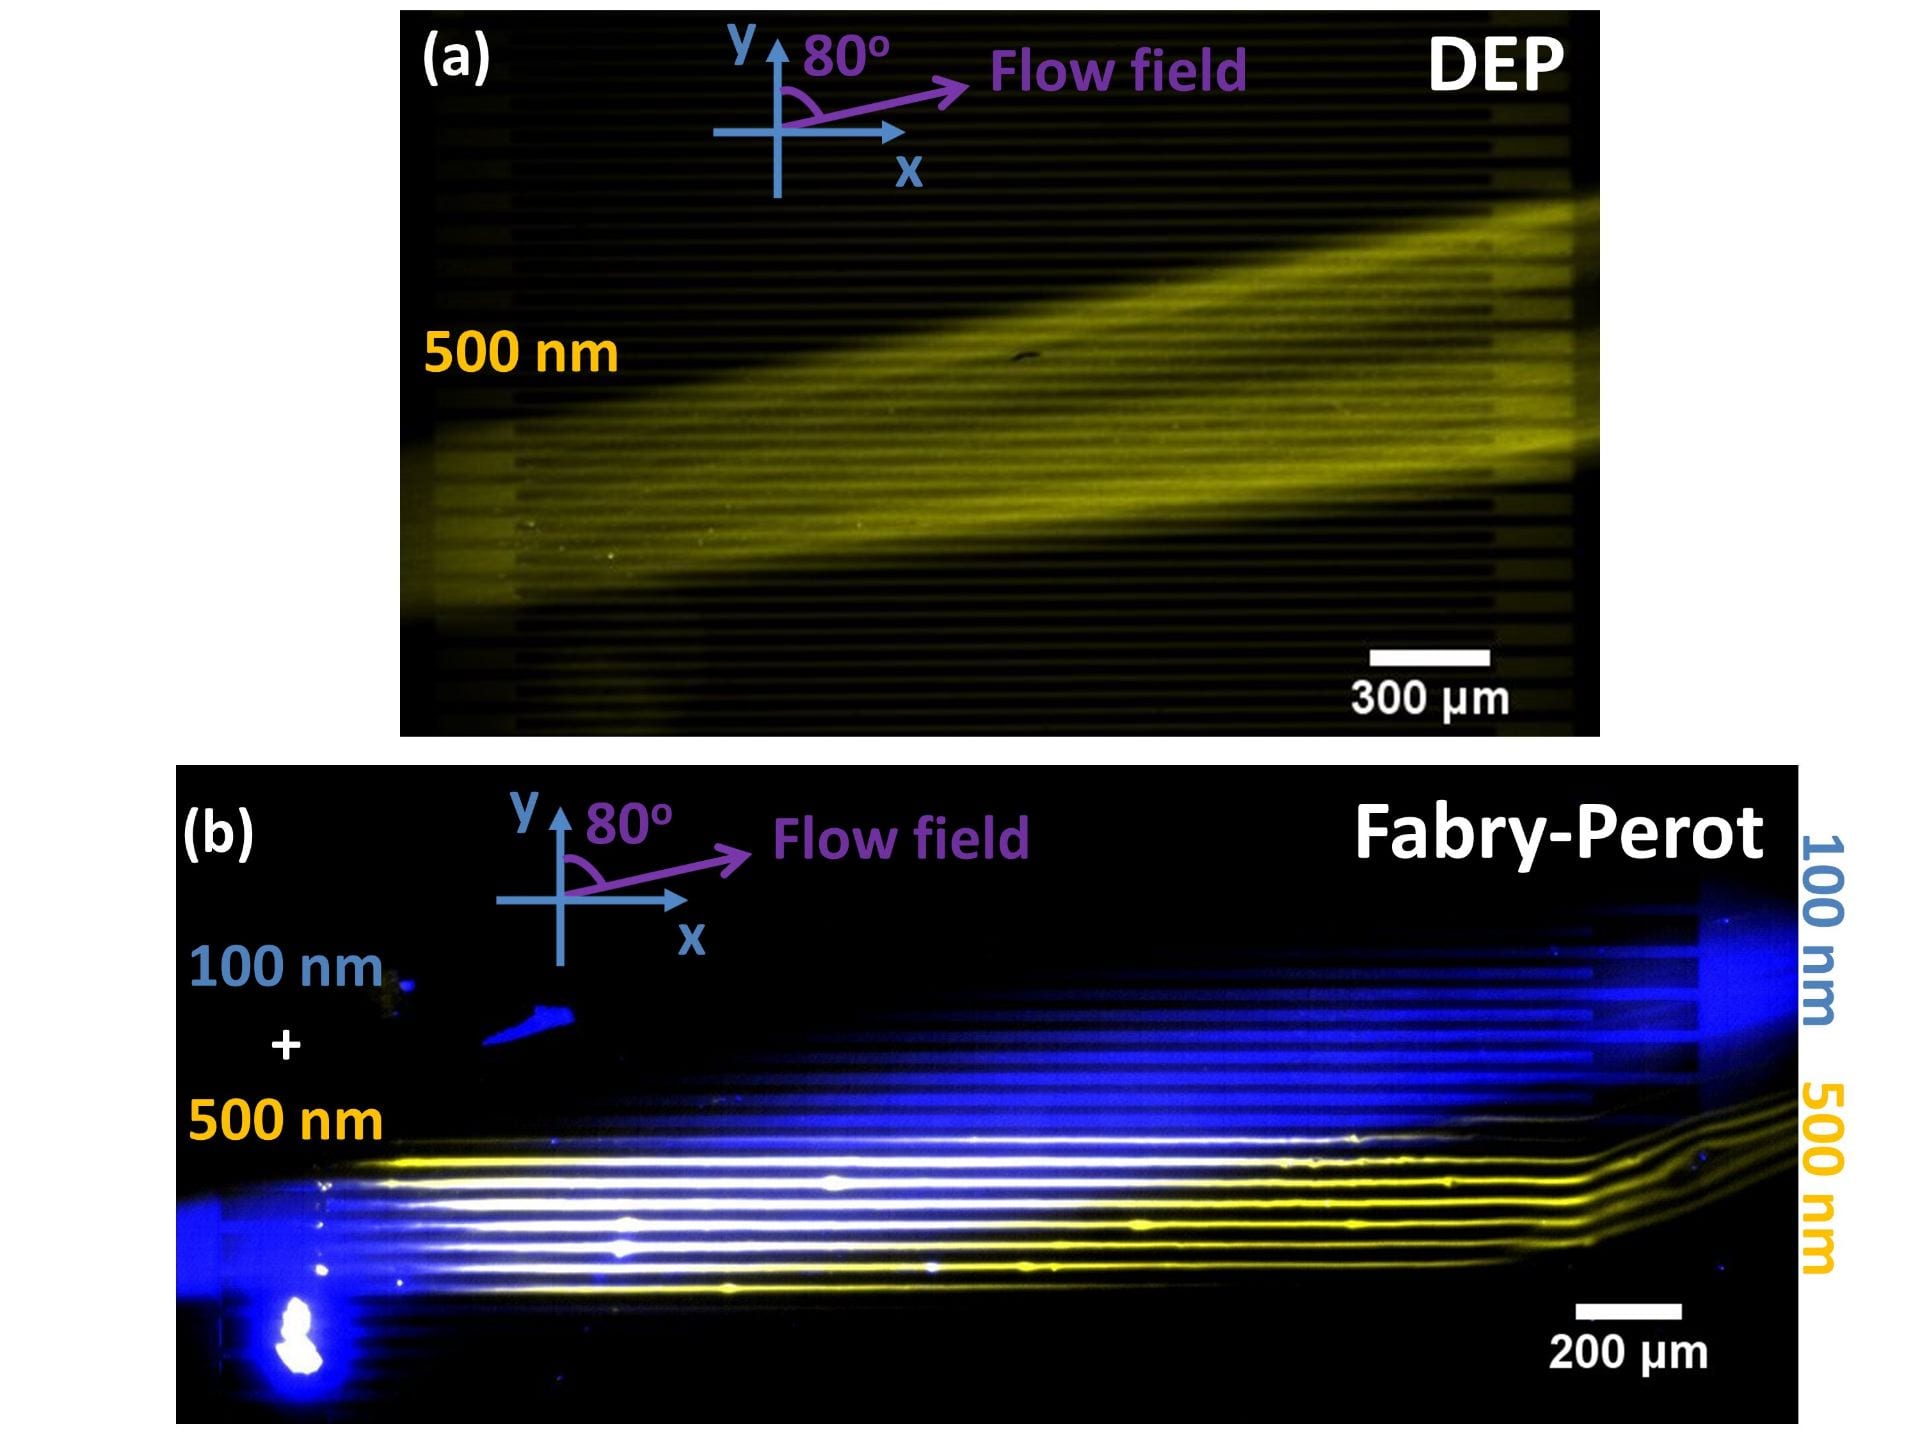
Figure 6. Comparison of the acoustic and the DEP effects on the particle trajectories. (a) Shows the mean fluorescent image of 500-nm (2.5% solids, Polysciences) particles in a glass DEP device. Total flow rate and peak-to-peak voltage (Vpp) are 6.5 (Sheath- 3, particles- 0.5, Sheath- 3) ul/min and 17.6 V, respectively. The flow rate in each outlet is 3.25 ul/min. (b) Shows the composite, false color, background-subtracted (in ImageJ with rolling ball radius = 494 um), and intensity-enhanced mean fluorescent image of 500-nm (yellow) and 100-nm (blue) particles in the Fabry-Perot device. Total flow rate and input power density are 12.2 (Sheath- 6, particles- 0.2, Sheath- 6) ul/min and 0.12 W/mm2 (Vpp =18.3 V), respectively. The flow rate in each outlet is 6.1 ul/min. Both devices are operated at 48.8 MHz.

Figure 7. Analytical transport of two sub-300 nm polystyrene populations. The inset shows mean sizes of 230-nm (orange) and 100-nm (blue) with the standard deviation of 10 nm. The Entry and Exit plots show y-distribution of the populations at the entry (mean=0, standard deviation = 20 um) and the exit of the IDT, respectively. The power density is 0.12 W/mm2 and the flow rate is 12.2 ul/min (i.e. p_a=3.07 MPa, U_F=1.2 mm/s). The threshold diameter is 290 nm.
