The Evaporative Demand Drought Index (EDDI), developed by the NOAA Physical Sciences Laboratory, is a new experimental tool that can be used as an early warning system for agricultural drought by evaluating evaporative demand of the atmosphere.
Evaporative demand can also be thought of as how ‘thirsty’ the air is. This atmospheric characteristic influences how quickly soils and vegetation dry out, which is why EDDI is a good estimation of drought stress for crops.
EDDI is calculated using observed temperature, humidity, windspeed, and solar radiation near the earths’ surface. It is updated weekly at multiple timescales. Click here to learn how an EDDI map can be interpreted.
One-week EDDI Map (7/18/20 to 7/25/20)

1-week Evaporative Demand Drought Index map from NOAA Physical Sciences Laboratory as of 25 July 2020. How to interpret an EDDI map.
Four-week EDDI Map (6/24/20 to 7/25/20)

4-week Evaporative Demand Drought Index map from NOAA Physical Sciences Laboratory as of 25 July 2020. How to interpret an EDDI map.
12-week EDDI map (4/24/20 to 7/25/20)
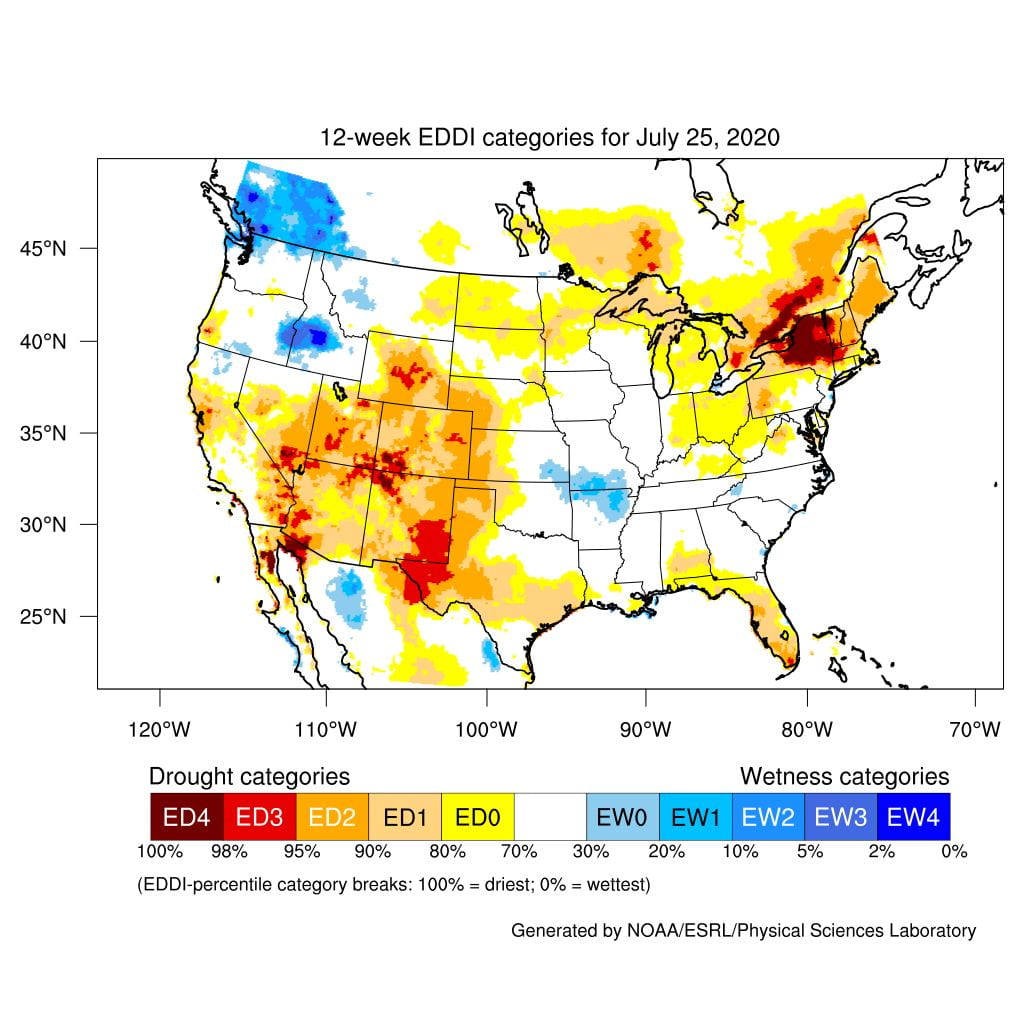
12-week Evaporative Demand Drought Index map from NOAA Physical Sciences Laboratory as of 25 July 2020. How to interpret an EDDI map.
This report is posted by the Network for Environment and Weather Applications (NEWA) which is part of the New York State Integrated Pest Management Program in the College of Agriculture and Life Sciences at Cornell University.