The NEWA website may be down for an hour during an upgrade. The upgrade will be done Tuesday, April 12, beginning at 1:00 PM. Plan accordingly.
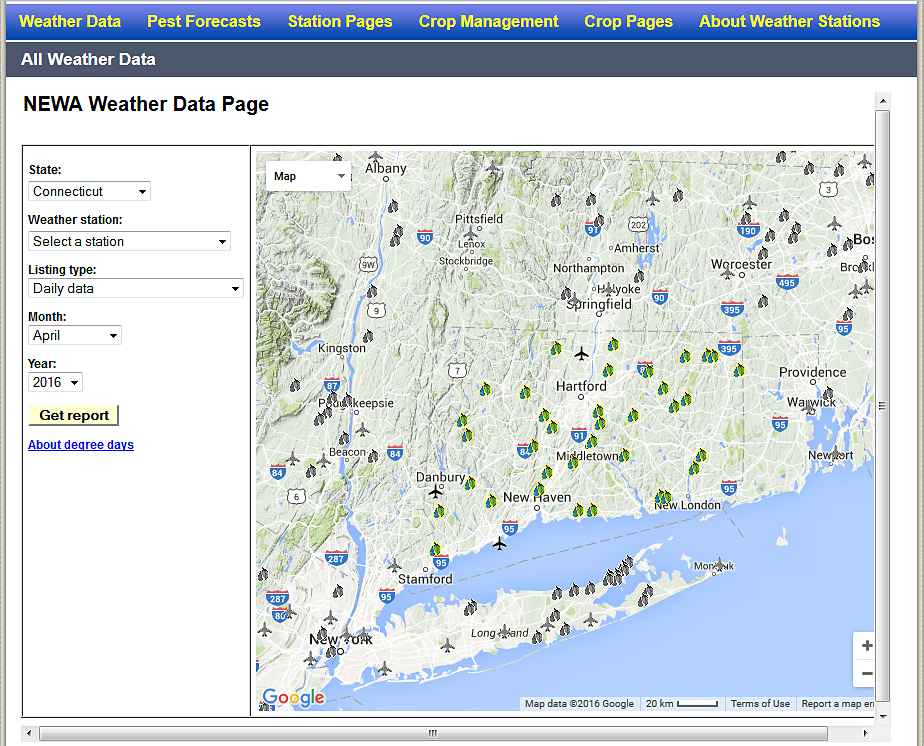
An upgrade for State-by-State access to Station Pages and to NEWA tools via state drop down lists is complete! You may have already seen how these work in the Weather Data tools, because we’ve got the state selection in those drop down lists now, see picture below.
The drop down lists on all the tools will now have a state selection box—when a state is selected, the map will center on that state. The weather station icons outside the selected state will turn gray and those within the state will remain colored and active.
New Station Pages links to states from the main menu—hovering over or tapping on the Station Pages menu item will open a list of all the states that NEWA has weather stations in. Click on a state to open the page with the state-specific map and links to all the Station Pages in that state.
We hope this upgrade makes it easier for you to get the NEWA weather apps. We appreciate hearing from you! newa@cornell.edu
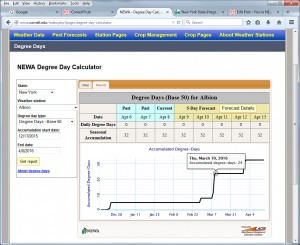
State selection in NEWA tools allows easier navigation to your weather station of choice.