Case Study – Part II: Central NY Farm Applies Adapt-N Rates on Whole Farm, Saves Money and Reduces Environmental Impact

Bianca Moebius-Clune1, Maryn Carlson1, Daniel Moebius-Clune1, Harold van Es1, Jeff Melkonian1 and Keith Severson2, 1 Department of Crop and Soil Sciences, Cornell University and 2 Cornell Cooperative Extension Cayuga County

Farm Background
Donald and Sons Farm in Moravia, NY grows about 1,300 acres of corn and soybean annually. Robert and Rodney Donald have been practicing variable rate N application for a number of years, taking advantage of their RTK-GPS system for soil sampling, input applications and yield monitoring. Until 2011, the farm used N application rates recommended by A&L Great Lakes Laboratories, based on soil tests done by field management unit. The Donalds applied the bulk of their fertilizer N at sidedress time, as they knew that early season applications run the risk of losses during wet springs. Recommendations ranged across their farm from 195 to 260 lbs of total N per acre, of which the Donalds applied 22 at planting.  In 2011, they spent $107,000 on N fertilizer – four times what they spent in 2000, due to increasing prices and a shift toward ever-higher recommended rates as yield potentials increased.

These large expenditures were a strong incentive to seek new tools to optimize application rates. As Rodney put it, “Money talks…and with what we are getting in corn for what we are putting on in ammonia, we’re not gaining.” In 2011, the Donalds decided to collaborate on the NY state-wide Adapt-N beta-testing effort. After the dry spring, the Adapt-N recommendation for their trial field was only 80 lbs N/acre, while their standard recommendation was 220 lbs N/acre. To their surprise, there was no yield penalty from reducing the N rate by 140 lbs N/acre. In state-wide trials, 2011 Adapt-N results were also very promising: 86% of trials showed higher profits using the Adapt-N rate, with an average increased profit of $35/acre (Moebius-Clune et al, 2012).

“I was pretty amazed with the program,” said Robert, who decided to participate in a workshop on Adapt-N at Cornell University in March 2012. He added, “Once you get the hang of the program it’s easy to use.”

The Adapt-N tool is transforming the way N recommendations are made by using high-resolution climate data and a dynamic simulation model to provide weather-adjusted, site-specific, in-season nitrogen recommendations. What sets Adapt-N apart from other methods for determining crop N needs is its explicit accounting for the interaction between early season weather and other factors like soil characteristics and management decisions. After a dry spring, N that has mineralized from organic sources or was applied early in the season remains available in the soil, so less needs to be sidedressed. But in a wet spring, N is easily lost from the system and thus more fertilizer N must be applied. That difference between years could be as much as 100 lb N/ac. Not only does such unmanaged uncertainty cut deeply into growers’ profits, but the environmental consequences are significant: leaching of excess nitrate affects water quality, and denitrification contributes to emissions of nitrous oxide, a potent greenhouse gas, that also depletes the ozone layer. Realizing that recommendations from Adapt-N could lead to significant savings for the farm (estimated at $70,000 for 2011 after a very dry spring with low losses) the Donald Brothers decided they were on board.

Anhydrous sidedress rig ready to head to the field.

Whole Farm Implementation of Adapt-N Rates
For the 2012 growing season, the Donalds used Adapt-N on their whole farm and implemented numerous trials. Robert entered the farm’s 90 management units into his account that spring via the user-friendly Adapt-N interface. “I spent one Saturday afternoon and all day on Sunday,” Robert noted. Between June 8 and 21, Rodney sidedressed 922 acres of corn, using their RTK-GPS system to target their variable rates. Recommendations from Adapt-N varied from 65 to 190 lbs N/acre among management units, depending on local temperature, precipitation, soil texture and organic matter content (varying from 1-6%), as well as the date of sidedressing. On each day of sidedressing, Robert entered updated N recommendations into their system (provided by the daily automatic Adapt-N sidedress alerts) for the fields to be sidedressed that day. He transferred this information to their calibrated RTK-GPS-guided anhydrous ammonia sidedresser via a USB device to automatically adjust N rates on-the-go.

Adapt-N data card used with RTK-GPS on 922 acres of corn. Check strips sidedressed with “Old Way” data card that contained their conventional rates.

Rodney sidedressed entire fields with the Adapt-N rate, except for single or replicated comparison strips of the conventional “old” rate implemented on 15 of their 18 corn fields. Most of the  strip trials followed an AOOA design (with “A” representing the Adapt-N rate and “O” representing the old rate).

Agronomic, Economic and Environmental Results
N rates as applied and yield monitor data for each trial area were retrieved from the Donalds’ AgLeader software at the end of the season. Yields and fertilizer application rates were visualized in map format and quantified within management units or as field-length strips.

Based on analysis of GIS data from the entire farm, Adapt-N resulted in profit gains in 83% of the trials. Averaged across all trials, savings were approximately $42/ac, with estimated total savings of over $30,000 for the farm after the fairly normal 2012 spring. Fields reached or exceeded the estimated yield potential in almost all cases, indicating that the Adapt-N recommended rates were high enough to achieve the expected yield. Yield losses were negligible (2 bu/ac) despite N fertilizer reductions by an average of 87 lbs/ac across all 24 fields.  Yield maps visually emphasized the lack of yield response in the higher N rate strips for almost all trials, as well as the potential impact of field variability on harvest yield.

Left: N application map for Trials 48-50 retrieved from calibrated anhydrous sidedresser – the green strip indicates the high rate grower-N strip, and the grey rectangle indicates a zero-N section (data not discussed here). Right: Yield map retrieved from calibrated yield monitor, with no visually apparent yield increase with higher Grower-N rate.
Comparison of yield and profit using the “Old” N application rates vs. those recommended by Adapt-N. N rates represent total N in lbs/ac applied as inorganic fertilizer in 2012.
Percent of trials with profit gain resulting from reduced Adapt-N rate (20 trials, $55/ac), profit losses resulting from underestimated expected yield input (4 trials, -$27/ac), and trials with unexplained profit losses (none).

The only cases of profit loss occurred in four trials, all exceeding the expected yield by up to 35 bu/ac. Yield losses could have been minimized with more precise expected yield inputs; the Donalds had entered a flat yield potential of 200 bu/ac for all fields, rather than basing the input on past field-specific yield records. Adapt-N is a precise tool that already accounts for the risks of uncertainty and differential losses from over and under-fertilization. Therefore, a good estimate of expected yield is critical to attaining accurate N recommendations.

Savings from whole-farm implementation of Adapt-N were coupled with significant environmental benefits. Informed by Adapt-N, the Donalds applied a non-area-weighted average of 87 lbs/ac less than recommended by A&L Laboratories across the implemented trials. The decrease in N applications reduced simulated total environmental N losses (until 12/15/2012) by an average of 70 lbs/ac, and reduced N leaching losses by an average of 10 lbs/ac.  In total, they saved about 67,000 lbs of unneeded N in 2012.

Refining Adapt-N Use in 2013
When asked whether they were planning to use Adapt-N again next year, Robert answered with an unequivocal “Oh yeah!” and added, “Gotta refine our use of the tool some.” Robert recognizes that for a precision tool like Adapt-N, a reasonable expected yield is particularly important. One of the biggest things Robert plans to change: He will use variable estimated yields for each management unit in 2013, based on 3 to 5 years of yield records for each management unit. He noted that one of his fields in Scipio, NY “won’t do 175 in the best of years. That’s where N is wasted,” while, “other fields can regularly reach 250 bu/ac” if given enough nitrogen. Also, he plans to use the new soil series name inputs that became available last June to further improve the precision of the recommendations.

The trials implemented at Donald & Sons Farm have greatly helped the team assess Adapt-N’s performance and demonstrate the efficacy of using the tool in conjunction with GPS equipment. Growers with similar technological capabilities can likewise maximize the potential of Adapt-N to improve their profits and reduce N inputs and losses.

More information. Adapt-N supporting publications, an in-depth training webinar, and access to the web-interface are available at http://adapt-n.cals.cornell.edu. This case study has been supported by  funds from New York Farm Viability Institute, the USDA-NRCS Conservation Innovation Program, and the International Plant Nutrition Institute.

Adapt-N Proves Economic and Environmental Benefits in Two Years of Strip-Trial Testing in New York and Iowa

Bianca Moebius-Clune, Maryn Carlson, Harold van Es, and Jeff Melkonian, Department of Crop and Soil Sciences, Cornell University

Adapt-N (http://adapt-n.cals.cornell.edu) is an on-line tool that uses a simulation model to incorporate location-specific, early season weather information, as well as soil and crop management inputs, to generate precise N sidedress recommendations for corn.

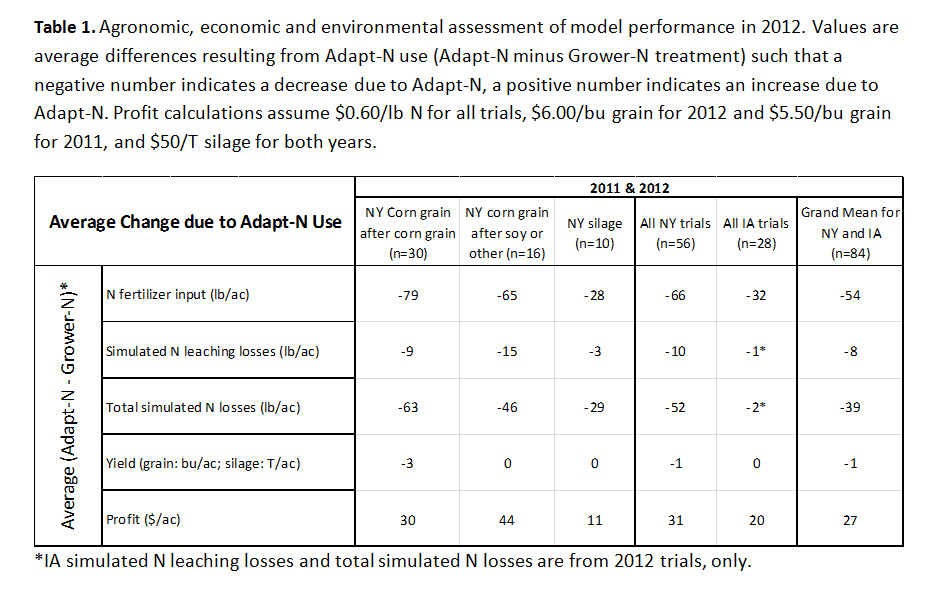
We conducted a total of 84 strip trials in 2011 and 2012 (Figure 1) in NY (56), Iowa (27) and Minnesota (1) to test how well Adapt-N predicts corn N needs at sidedress time. Yield data and estimated leaching losses from all 84 trials show that, when used correctly, the Adapt-N tool significantly increased grower profits and decreased environmental losses. Thus, Adapt-N provided an economic benefit to growers, while also minimizing N losses to the environment in almost all instances. With increasing interest in Adapt-N among growers, consultants, and agricultural service providers throughout the United States and beyond, Adapt-N use has the potential to reduce corn agriculture’s contribution to greenhouse gas emissions, groundwater pollution, and hypoxia in our estuaries, while substantially increasing grower profits.

This article summarizes the results of all 84 trials (Table 1, Figure 2) and describes specific trials that provide insights into how to most effectively use Adapt-N.

Methods
We completed 18 replicated strip trials in 2011, and 42 in 2012, on commercial and research farms throughout New York. We also conducted 9 strip trials in 2011, and 19 in 2012 on commercial farms throughout Iowa (1 trial in Minnesota is included with the Iowa trials in 2012). The trials involved grain and silage corn in fields with varying management history (i.e. organic amendments, crop rotation, tillage practices, etc.). Sidedress treatments involved at least two rates of nitrogen, a conventional “Grower-N” rate based on current grower practice and an “Adapt-N” recommended rate.  A simulation was run for each field just prior to sidedressing to determine the weather-adjusted Adapt-N rate.

Yields were measured by weigh wagon, yield monitor, or in a few cases by representative sampling (two 20 ft x 2 row sections per strip). Partial profit differences between the Adapt-N recommended and Grower-N management practices were estimated through a per-acre partial profit calculation. Yields were used as measured, regardless of statistical significance, since the statistical power to detect treatment effects is inherently low for two-treatment strip trials. For corn grain, a 2011 grain price of $5.50/bu and 2012 price of $6.00/bu were assumed. For silage, $50/T was used in both 2011 and 2012, based on reported NY silage prices. A nitrogen fertilizer price of $0.60/lb was used, based on reported NY and IA fertilizer prices.

Total N losses to the environment (atmosphere and water) and N leaching losses in 2011 and 2012 were estimated for each treatment through model simulations through October 30 for 2011 NY trials, and through December, 15 in 2012 trials.

More detailed descriptions of the 2011 and 2012 methods were provided in previous WCU articles (Moebius-Clune et al., 2012; Moebius-Clune et al., 2013).

Economic Comparison
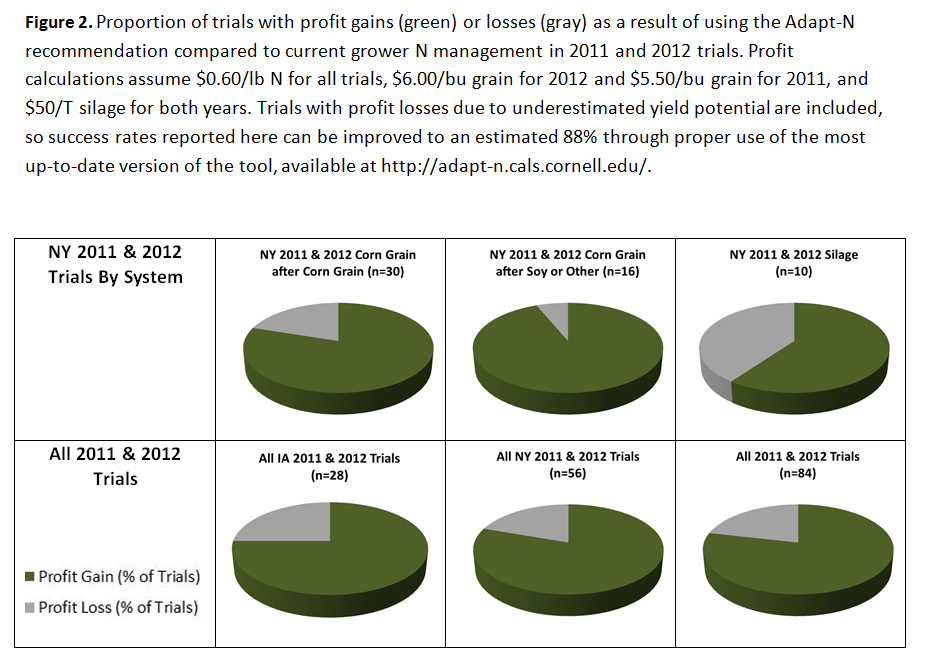
Profit gains from the use of Adapt-N were considerable.  Profits increased in 80% of all NY trials, in 75% of all IA trials, and in 79% of all 84 trials when growers followed Adapt-N recommendations. Profit gains of $27/ac on average ($31/ac in NY, $20/ac in IA) were primarily attributed to fertilizer cost savings due to lower Adapt-N recommended rates without significant yield losses. Profit gains were also achieved in some instances where Adapt-N recommended higher N rates, and consequent yield increases were achieved (3 trials). Adapt-N rates resulted in average N input reductions of 66 lbs/ac in NY, 32 lbs/ac in IA, and 54 lbs/ac overall. Yield losses decreased by only 1 bu/ac on average in the 84 trials (a statistically insignificant yield loss), indicating that Adapt-N’s reduced N recommendations were generally justified.

Because of the potential impact of field variability on the results of a single trial, analysis of all 84 trials provides the most meaningful assessment of Adapt-N performance and likelihoods for improving grower profits. A look at specific trials can provide insight into effective use of the tool. Yield losses (not always statistically significant), and sometimes profit losses, occurred in several 2012 trials where the user’s ‘expected yield’ input in Adapt-N was an underestimate of the yield achieved with the higher N rate (7 trials in 2012). Adapt-N is a precise tool that already fully accounts for the risks of uncertainty and differential losses from over and under-fertilization.  If the yield potential of the field is higher than the ‘expected yield’ provided to the model, Adapt-N is more likely to recommend insufficient N to achieve a higher yield.  Therefore, a good estimate of expected yield is crucial to attaining accurate N recommendations. Analyzing 3 to 5 years of yield history to determine the expected yield input will maximize the accuracy of yield predictions and thus improve Adapt-N recommendations.

Adapt-N recommended a higher N rate than grower practice in 10% of trials, mostly due to wet spring conditions. In 3 of these 8 trials, the higher N rate resulted in a profit increase due to corresponding yield gains, thus justifying the higher N rate. In the 5 instances where a higher Adapt-N rate resulted in profit losses, unpredictable late-season drought conditions resulted in substantial yield reductions below the expected yield in both treatments. Due to insufficient water availability, the crop was unable to make use of the additional N applied in the Adapt-N treatment, thus the additional N fertilizer cost contributed to profit losses. While such individual situations are not preventable, because post-sidedress drought cannot be predicted by tools currently available, assessment of all trials shows that use of the Adapt-N rate provided increased profitability, while decreasing N inputs, in most cases.

In 2011, Adapt-N recommendations in corn-soybean rotations were low due to a deficiency in how Adapt-N implemented soybean N crediting. However, savings from N reductions in 80% of these trials were large enough to compensate for the respective yield reductions. This error was corrected, and no further profit losses occurred in 2012 trials where corn followed soybean (Moebius-Clune et al., 2013).

Large N input reductions achieved with the use of Adapt-N can often compensate for small yield losses with the lower N rate. For example in one of the 2012 Iowa trials, Adapt-N recommended 0 lbs N/ac as compared with the conventional N rate of 75 lbs N/ac. Despite a yield reduction (9 bu/ac), the Adapt-N rate did not decrease profit (+$1/ac), due to the large reduction in sidedress fertilizer and operational expense. This trial is one of many that demonstrate that growers currently applying high rates of N can realize significant profit gains by using Adapt-N even if yields are somewhat reduced.

Environmental Benefits
Adapt-N reduced N rates by 54 lbs N/ac on average, in 90% of trials, resulting in significant reductions in N losses to the environment. By the end of the growing season, simulated N leaching losses decreased by an average of 10 lbs N/ac, and total N losses decreased by an average of 34 lbs N/ac. In 2012, simulated total N losses and particularly leaching losses of sidedress-applied excess nitrogen remained relatively low by December due to widespread dry conditions during the growing season in NY and especially in IA. Further losses of residual excess N have occurred over the winter and spring months of 2011-2012 and 2012-2013. In silage trials, the pre-plant application of manure, and consequent lower inorganic fertilizer rates at sidedress time, limits the potential magnitude for reductions in N losses in comparison with non-manured fields, although Adapt-N can nevertheless significantly reduce fertilizer application in these systems.

Conclusions
Two consecutive growing seasons of on-farm strip trial testing have shown that Adapt-N is an effective tool for N management in corn systems, resulting in profit gains in 79% of trials, on average by $27/ac ($31/ac in NY and $20/ac in IA). When accounting for the now implemented correction of a soybean credit model deficiency, and underestimated yield potential inputs, we estimate that profit gains would have been achieved in 88% of trials to date. Other pointers for attaining the most accurate Adapt-N recommendations include:

  • Estimate expected yield based on 3 to 5 years of accurate yield information.
  • Use representative manure test results from actual manure inputs to reduce the margin of error associated with manure applications.
  • Create field locations in Adapt-N by discrete management unit. Determine management units by several key factors: i.e. soil type, historical yield data, and organic matter content.
  • Take management unit specific soil samples at least every 3 years to determine an accurate organic matter content value, ideally to a 12” depth.
  • Run Adapt-N on the sidedress date if possible – use the daily alert feature for automatic updated recommendations on all fields.

In summary, Adapt-N strip trial results from 2011 and 2012 have shown that using Adapt-N to predict corn N needs at sidedress time provides economic advantages to growers as well as environmental benefits due to more precise management of N. Adapt-N thus provides a strong incentive to shift N applications to sidedress time, ultimately increasing grower profits and reducing N losses to the environment in both wet and dry years.

For more information: The Adapt-N tool and training materials are accessible through any device with internet access (desktop, laptop, smartphone, tablet) at http://adapt-n.cals.cornell.edu/. Information on account setup and the recorded 3/21/2013 in-depth training webinar are posted. Adapt-N users can elect to receive email and/or cell phone alerts providing daily updates on N recommendations and soil N and water status for each field location in Adapt-N.

Acknowledgements:  The development and testing of the Adapt-N tool was supported through funds from Cornell University, USDA-NIFA Special Grants on Computational Agriculture and the Agricultural Ecosystems Program (U.S. Rep. Maurice Hinchey-NY), Northern NY Agricultural Development Program, a USDA-NRCS Conservation Innovation Program, NY Farm Viability Institute, International Plant Nutrition Institute, and MGT Envirotec. We are grateful for the cooperation in field activities from Bob Schindelbeck, Keith Severson, Kevin Ganoe, Sandra Menasha, Joe Lawrence, and Anita Deming of Cornell Cooperative Extension, from Mike Davis at the Willsboro Research Farm, from Dave DeGolyer, Dave Shearing and Jason Post at the Western NY Crop Management Association, from Eric Bever and Mike Contessa at Champlain Valley Agronomics, from Mark Ochs and Ben Lott at Mark Ochs Consulting, and from Peg Cook at Cook’s Consulting in New York, from Kevin Kuehner of Minnesota Department of Agriculture, and from Shannon Gomes, Hal Tucker, Michael McNeill, and Frank Moore at MGT Envirotec in Iowa. We also are thankful for the cooperation of the many farmers who implemented these trials on their farms. In particular we would like to acknowledge Robert and Rodney Donald for implementing farm-wide trials on most of their fields (Moebius-Clune et al., 2013b).

References
Moebius-Clune, B., M. Carlson, D. Moebius-Clune, H. van Es, and J. Melkonian. 2013. Case Study – Part II: Donald & Sons Farm Implements Adapt-N Rates on Whole Farm, Saves Money and Environment. What’s Cropping Up? TBD.

Moebius-Clune, B., M. Carlson, H. van Es, and J. Melkonian. 2013. Adapt-N Increased Grower Profits and Decreased Nitrogen Inputs in 2012 Strip Trials. What’s Cropping Up? Preview.

Moebius-Clune, B., H. van Es, and J. Melkonian. 2012. Adapt-N Increased Grower Profits and Decreased Environmental N Losses in 2011 Strip Trials. What’s Cropping Up? No. 2, 22.

Adapt-N Increased Grower Profits and Decreased Nitrogen Inputs in 2012 Strip Trials

Bianca Moebius-Clune, Maryn Carlson, Harold van Es, and Jeff Melkonian, Department of Crop and Soil Sciences, Cornell University

Adapt-N is an on-line tool for precision nitrogen management in corn (grain, silage, sweet), which has been available to growers in the Northeast and five Midwestern states for the past two years.  It is a computational tool based on the concept that seasonal corn N needs can be estimated much more accurately in the late spring when factoring in weather, soil and management information.  The main question for growers and other stakeholders is whether the tool provides recommendations that increase profits and reduce environmental impacts.  We are answering those questions through on-farm strip trials.  The 2011 results were reported by Moebius-Clune et al. (What’s Cropping Up? Vol. 22, No. 2, 2012) and showed very encouraging results.  We are discussing the 2012 strip trial results in this article, and a summary article for all site-years is also included in this volume.

Adapt-N (http://adapt-n.cals.cornell.edu) uses a well-calibrated computer model, and combines user information on soil and crop management with high-resolution weather information, to provide N sidedress recommendations and other simulation results on nitrogen gains and losses. As a result of 2011 beta-testing, several improvements to Adapt-N were implemented for the 2012 growing season, including adjusted soil type, previous crop, manure and irrigation input options. Model routines for soybean N contributions were adjusted to avoid artificially low N recommendations that had occurred in 2011 and an uncertainty-adjusted price-ratio correction factor to optimize profits from N application was also incorporated into the Adapt-N tool. This factor takes into account several key realities that affect farmer profit: 1) the prices of fertilizer and grain, 2) the variable risks associated with over- and under-fertilizing, and 3) the reduced uncertainty in the optimum N rate with use of this precision tool. Using a fertilizer to grain price ratio of 0.1 ($0.60/lb N: $6 bu grain) Adapt-N subtracted 8 lb N/ac from the model-predicted Agronomic Optimum N Rate (AONR) to determine the Economic Optimun N Rate (EONR).

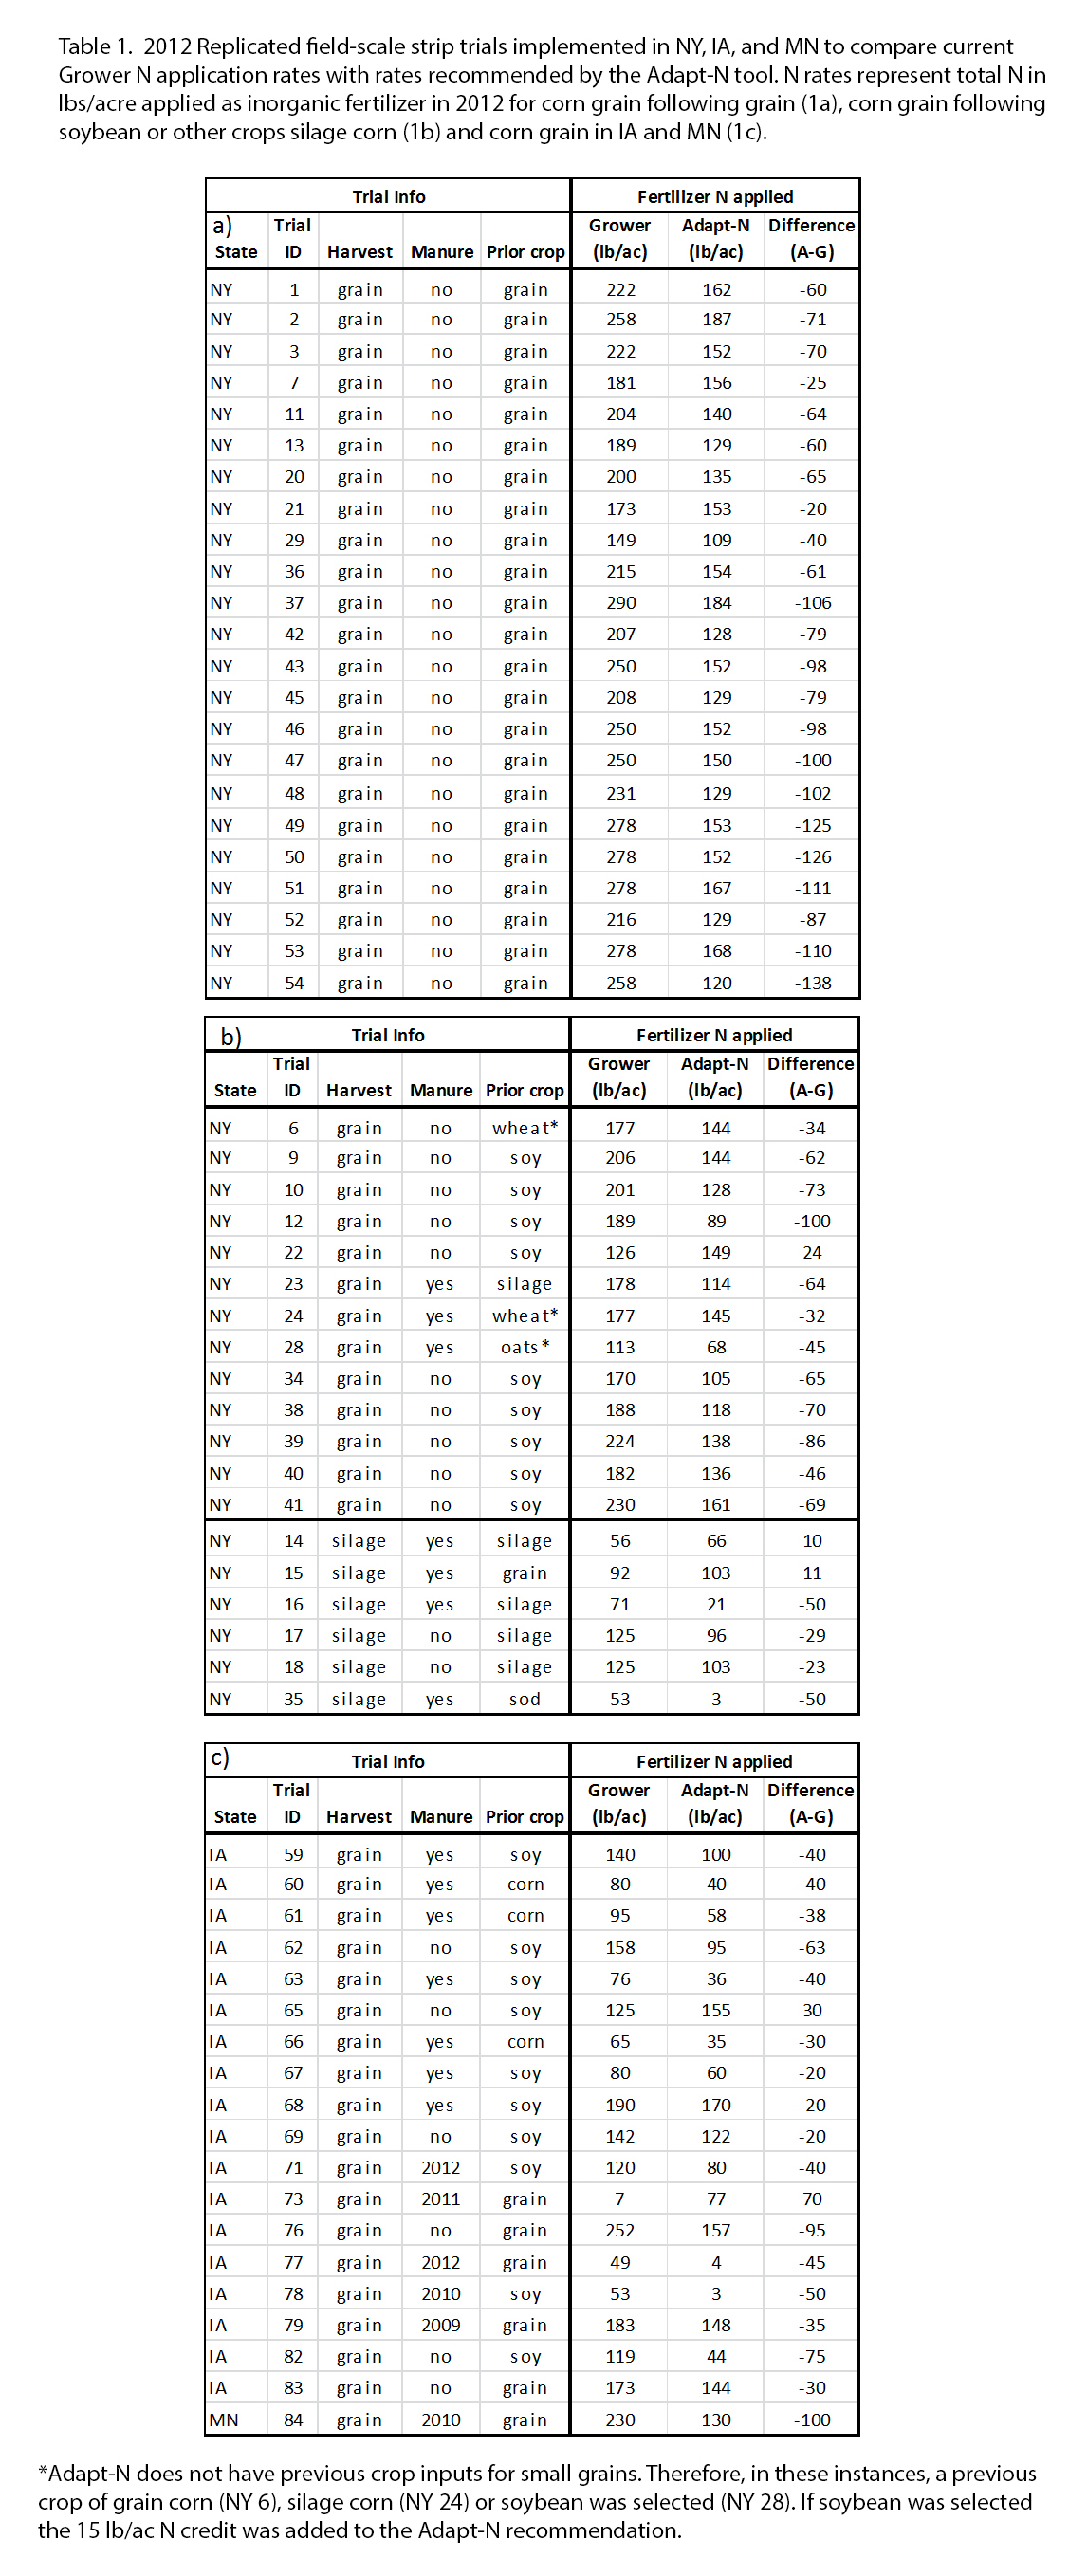
On-Farm Strip Trials. We completed 42 replicated strip trials on commercial and research farms throughout New York and 19 replicated strip trials in Iowa (1 trial in Minnesota, included with the “Iowa trials”) on commercial farms during the 2012 growing season. The trials involved grain and silage corn, with and without manure application, and different rotations (corn after corn, corn after soybean or other; Table 1). Sidedress treatments involved at least two rates of nitrogen, a conventional “Grower-N” rate based on current grower practice and an “Adapt-N” recommended rate, based on a simulation run just prior to sidedressing. In 2012 NY trials, all but three Adapt-N rates were lower than conventional N rates (by 20 to 138 lbs/ac; Table 1). In 2012 Iowa trials, all but two Adapt-N rates were lower than the conventional N rates (by 20 to 100 lbs/ac; Table 1). Growers in IA and NY implemented field-scale strips with 2-7 (usually 4) replications per treatment.

Yields were measured by weigh wagon, yield monitor, or in a few cases by representative sampling (two 20 ft x 2 row sections per strip). Partial profit differences between the Adapt-N recommended and Grower-N management practices were estimated through a per-acre partial profit calculation:

Profit = [Adapt-N yield – Grower-N yield] * crop price – [Adapt-N rate – Grower-N rate] * price of N + Sidedress operation savings/loss

Yields were used as measured, regardless of statistical significance, since the statistical power to detect treatment effects is inherently low for two-treatment strip trials, but averaging across large numbers of trials provides good statistical power for assessing Adapt-N performance. For corn, a 2012 grain price of $6.00/bu was assumed ($7.00/bu minus $1.00/bu for drying, storing and trucking from PA Custom Rates; USDA, 2012). For silage, $50/T was used based on reported NY silage prices of $25-75/T. A nitrogen fertilizer price of $0.60/lb N was used (reported prices ranged from $0.42 – $0.80/lb N in NY and IA). When Adapt-N recommended no need for sidedressing and the Grower-N rate was greater than 0 lbs/ac, sidedress operational savings of $8/ac were added to the profit. If Adapt-N recommended an application of N and the Grower-N rate was 0 lbs/ac N, a loss of $8/ac was subtracted from the profit. Agronomic and economic outcomes of these trials were used to assess Adapt-N performance.

Results
Agronomic and economic comparisons between Grower-N and Adapt-N treatments for each trial are provided for NY and IA trials in Table 1 and Figure 1, and as averages in Table 2.

NY corn after corn trials (Figure 1 a-c). Adapt-N rates in all of the NY grain after grain trials resulted in N input reductions of 82 lb N/ac on average. In all but one trial, no significant yield loss was measured with these reduced N rates. Adapt-N rates provided a profit advantage over conventional N rates in almost all trials (by $1.62 to $88.20/acre). In 4 of the 5 instances where Adapt-N rates resulted in profit losses, actual yield achieved with the higher N rate exceeded the expected yield used in the Adapt-N simulation (by 9 bu/ac to 35 bu/ac) to estimate the sidedress rate. In each of these four cases, a more appropriate expected yield would have been available from existing yield records, and would have likely resulted in a sufficient recommendation from Adapt-N.

NY corn after soybean or other crops (Figure 1 d-f). Adapt-N rates in all NY corn grain after soybean trials (or after other crops such as wheat, oats, silage) consistently resulted in profit increases (of $7.64 to $105.30/acre). These results demonstrate that the soybean N crediting method used for 2012 successfully corrected the 2011 error. Harvest data show that, despite large N input reductions in Adapt-N treatments (average 56 lbs/ac), reductions in yields were negligible in all trials and only statistically significant in one case (Trial 34). In the only trial where Adapt-N recommended a higher rate (by 23.5 lbs/ac, Trial 22), yield increased by 6 bu/ac and a profit was realized despite higher fertilizer cost.

NY silage (Figure 1 g-i).  Adapt-N rates in 4 of 6 NY silage trials resulted in N input reductions (22.5 – 50 lbs/ac). No statistically significant yield loss with these reduced N rates was found (average 0 T/ac difference when N rates were decreased). Adapt-N rates provided a measured profit advantage over conventional N rates in two of these trials (by $48 and $58/acre) when N rates were reduced by 50 lbs/ac. Profit losses in the other four cases were due to field variability, underestimated yield potential, small N rate differences, and/or drought. Two of these trials (17 and 18) registered a profit loss due to small yield losses because yields were higher than the ‘expected yield’ entered into Adapt-N, in addition to artificially low Grower-N rates as the grower was already reducing N rates to near Adapt-N rates (55-75 lb/ac below standard recommendations that use current yield potentials). In comparison to standard recommendations, these trials would constitute profit gains with Adapt-N use. In two trials, Adapt-N rates were higher by 10-11 lbs/ac, justified by the expected yield input of 22 and 24 T/ac respectively (Trials 14 and 15). Due to drought, measured yields were well below expected yields (by 5.3 and 11.8 tons), and due to field variability, measured yields were lower in plots with the higher Adapt-N rate, resulting in a calculated profit loss.

Silage trials were less numerous, and exhibited greater yield variability than non-manured grain trials, making it more difficult to assess Adapt-N performance. Factors contributing to such variability are low precision in manure testing and application (in comparison to synthetic fertilizer), unevenness of spreading, and the effects of drought in several trial locations. An overall assessment of the currently available data in silage trials for 2011 and 2012 (Moebius-Clune et al. 2013a) suggests that the model is handling these well, and that profit gains are achieved particularly with large N use reductions at sidedress, but further testing is desirable.

IA corn grain trials (Figure 1 j-l). The majority of 2012 Iowa trial results were impacted by abnormally droughty conditions. Still, Adapt-N rates in all but two of the 19 IA trials resulted in N input reductions (by 36 lb/ac on average). Except for one trial, no significant yield loss was measured with these reduced N rates. Adapt-N rates provided a profit advantage over conventional N rates in 74% of the trials (by $1.49 to $81.20/acre). In one of the three trials where N reductions resulted in profit losses, actual yield achieved with the higher N rate exceeded expected yield used in Adapt-N by 9 bu/ac (Trial 62), resulting in a profit loss despite N savings. In the 2 trials (65 and 73) where Adapt-N recommended a higher rate than the conventional N rate (by 30 lb/ac and 40 lb/ac respectively; the latter was accidentally implemented as 70 lb/ac), the expected yield was not attained due to mid-season drought, resulting in profit losses from unnecessary N application.

Conclusions
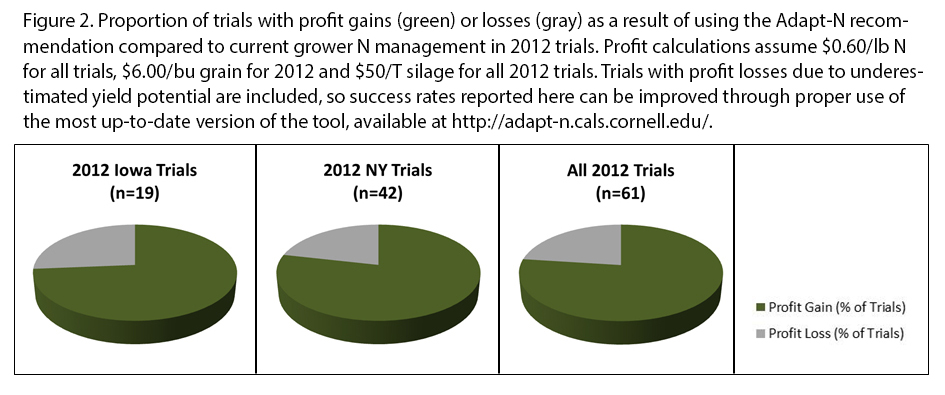
Our 2012 Adapt-N trials affirm our 2011 conclusions: The value of the Adapt-N tool is substantial, resulting in significant N input and loss reductions and in profit savings in 77% of all trials (Table 2, Figure 2). Of the 2012 recommendation errors, half (7 trials) were preventable with better expected yield inputs, and only 5% were unexplained. Recommendation errors in 2012 resulting in profit losses mostly occurred in instances where expected yield either exceeded or underestimated actual yield, thereby demonstrating the importance of a good estimate of the expected yield in generating accurate N recommendations using Adapt-N. Drought conditions during the growing season resulted in abnormally low yields in several trials. Obviously, Adapt-N or other N recommendation methods are unable to account for abnormal weather events that occur after the window for sidedressing has passed. The tool was, however, successful in adjusting for the significant effects of early season conditions to recommend N fertilizer needs more precisely.

Over the 2012 growing seasons, 61 trials indicate that:

  • Grower profits increased on average by $32/ac in NY, and by $17/acre in IA trials with the improved 2012 model version.
  • N application rates were significantly reduced in almost all cases, by 54 lbs N/ac on average, and thus post-growing season losses of excess N to the environment were decreased substantially.
  • Yield losses were generally negligible (-1 bu/ac average across all trials), despite the reduced N inputs
  • Higher N recommendations were justified by higher yields when drought was not the greater limiting factor.
  • 77% of Adapt-N recommendations provided increased grower profits over current rates in 2012, when including inadequate expected yield inputs, 87% when these are excluded.
  • Model inputs, especially yield expectation, must be carefully chosen to represent field-specific conditions.

In all, growers can realize large savings with the use of Adapt-N, which also provides strong incentives to shift the bulk of N applications to sidedress time, and will in the long term decrease environmental losses.

For more information: The Adapt-N tool and training materials are accessible through any device with internet access (desktop, laptop, smartphone, tablet) at http://adapt-n.cals.cornell.edu/. Information on account setup and the recorded 3/21/2013 in-depth training webinar are posted there. Adapt-N users can elect to receive email and/or cell phone alerts providing daily updates on N recommendations and soil N and water status for each field location in Adapt-N.

Acknowledgements:  The development and testing of the Adapt-N tool was supported through funds from Cornell University, USDA-NIFA Special Grants on Computational Agriculture and the Agricultural Ecosystems Program (U.S. Rep. Maurice Hinchey-NY), Northern NY Agricultural Development Program, a USDA-NRCS Conservation Innovation Program, NY Farm Viability Institute, International Plant Nutrition Institute, and MGT Envirotec. We are grateful for the cooperation in field activities from Bob Schindelbeck, Keith Severson, Kevin Ganoe, Sandra Menasha, Joe Lawrence, and Anita Deming of Cornell Cooperative Extension, from Mike Davis at the Willsboro Research Farm, from Dave DeGolyer, Dave Shearing and Jason Post at the Western NY Crop Management Association, from Eric Bever and Mike Contessa at Champlain Valley Agronomics, from Mark Ochs and Ben Lott at Mark Ochs Consulting, and from Peg Cook at Cook’s Consulting in New York, from Kevin Kuehner of Minnesota Department of Agriculture, and from Shannon Gomes, Hal Tucker, Michael McNeill, and Frank Moore at MGT Envirotec in Iowa. We also are thankful for the cooperation of the many farmers who implemented these trials on their farms. In particular we would like to acknowledge Robert and Rodney Donald for implementing farm-wide trials on most of their fields (Moebius-Clune et al., 2013b).

References
Moebius-Clune, B., M. Carlson, H. van Es, and J. Melkonian. 2013a. Adapt-N Proves Economic and Environmental Benefits in Two Years of Strip-Trial Testing in New York and Iowa. What’s Cropping Up? Preview.

Moebius-Clune, B., M. Carlson, D. Moebius-Clune, H. van Es, and J. Melkonian. 2013b. Case Study – Part II: Donald & Sons Farm Implements Adapt-N Rates on Whole Farm, Saves Money and Environment. What’s Cropping Up? TBD.

Moebius-Clune, B., H. van Es, and J. Melkonian. 2012. Adapt-N Increased Grower Profits and Decreased Environmental N Losses in 2011 Strip Trials. What’s Cropping Up? 22. [URL verified 4/27/13].

Rye vs. Oat Cover Crops on a Manured Field: Environmental Benefits Vary Greatly

Chris Graham, Harold van Es, and Bob Schindelbeck, Department of Crop and Soil Sciences, Cornell University

Land application of manure creates conditions conducive for significant environmental losses of nutrients. Application of manure involves large amounts of the nutrients nitrogen and phosphorus, often resulting in excess residual levels – especially after dryer growing seasons. Losses are especially acute in the following winter and spring as excess water from snow melt and rain promotes runoff and erosion of P, leaching of nitrate, and emissions of nitrous oxide from denitrification.  The latter is a significant greenhouse gas concern.

Cover crops are increasingly adopted for various purposes, including to suppress weeds, reduce runoff and erosion, build soil health, provide nitrogen (from legumes), or immobilize leftover nitrates.  For manured fields, winter cover crops may have special benefits by limiting P losses through reduced runoff and erosion, and by scavenging residual N and making it unavailable for leaching and denitrification.

In this study, we tested the ability of oats (Avena sativa L.) and winter rye (Secale cereal L.) cover crops to reduce nutrient losses through multiple potential pathways during the early winter and spring season in a soil with a history of manure application.  Winter rye and oats were selected due to their popularity in the northeastern USA and also for their difference in winter tolerance.  Oats establish well in the fall but are winter killed in our climate, which eliminates the need to terminate their growth in the spring. Rye, on the other hand, survives through our winters and resumes active growth early in the spring. Both cover crops provide soil cover and take up residual N from the previous growing season, thereby reducing both N and P losses. We hypothesized that rye, as it growth longer into the fall and re-establishes in the spring, is more effective at reducing environmental losses than oats.

Methods

This study was conducted on a working dairy farm located in Central New York using a field with a recent history of manure application. The soil at the research site is an Ovid silt loam with 4% average organic matter content in the surface soil and pH of 7.1. During the previous three years, manure was applied in April 2008, October 2009 and April 2010 (final application before study commenced) at total N rates of 145, 170, and 100 lbs per acre, respectively.

Winter rye and oats were broadcast seeded on 24 September 2010 after corn silage harvest in a spatially-balanced complete block design at a rate of 100 lbs per acre. Along with control plots, each cover crop treatment was replicated four times for a total of twelve plots. Quadrats of rye and oats were subsequently harvested on 3 December, 2010 and analyzed for N uptake. The Roots were harvested to a depth of 6 inches.  Soil samples were taken on 3 December, 14 March, 7 April, and 28 April from the 0-to-6 and 6-to-12 inch soil layers for mineral N analysis. Also, on the latter two dates soil material was collected for measurement of nitrous oxide emission potential using a method involving simulated rainfall (to induce denitrification) and 96-hour incubation at the seasonal temperatures (50oF for 7 April and 60oF for 28 April).  Soil water was sampled at 20 inch depth using a tension lysimeter to determine the nitrate content.

Results

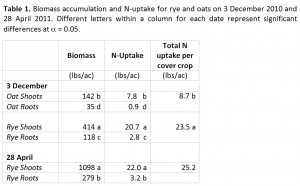
Table 1.

Cover Crop Biomass and N Contents

The rye cover crop produced much higher levels of biomass than the oats during the fall season after seeding, as measured on 3 December (Table 1). Aboveground biomass was three times greater in the rye plots than oats, as the former grew more vigorously and was not affected by frost kill. Larger surface biomass for rye implies that it provides greater benefits for reducing runoff, erosion, and P losses.  Also, rye nitrogen uptake was 23.5 vs. 8.7 lbs per acre (269% greater) compared to the oats.  On 28 April, the rye had accumulated more than twice the biomass compared to 3 December, but the total N uptake was similar (about 25 lbs per acre; Table 1).

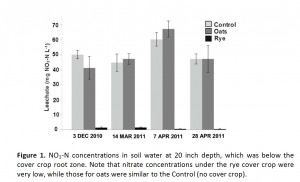
Figure 1.

Nitrate Leaching

Cover crop effects on nitrate concentrations below the root zone (20 inch depth) were found to vary considerably (Figure 1). Rye significantly and markedly decreased NO3-N concentrations compared to the Control and Oats treatments. Concentrations under oats in fact were about the same as the plots without cover crop – basically indicating that they had no benefit for reducing leaching.  Throughout the spring season, average measured nitrate levels were 43, 52, and 1 mg NO3-N L-1 for the Control, Oat and Rye plots, respectively.

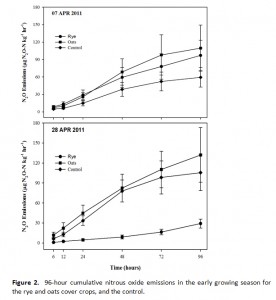
Figure 2.

Nitrous Oxide Emissions

While variability was high, both spatially and temporally, significant results were found in nitrous oxide emissions. Treatment effects changed as the spring season progressed (Figure 2). The Oats treatment produced similar results to the Control throughout the sample period while Rye decreased N2O emissions in late April after a high initial flux earlier in the month.  Higher emissions were measured at the early sampling from plots with cover crops, which had a relatively fresh carbon source that promotes denitrification. Reductions in the Rye plots later in April, were presumably the result of a smaller soil nitrate pool, as the rye cover crop had taken up much of the released N. Average emissions from the Rye treatment were roughly half of the Oats treatments during the final sampling.

Conclusions

The results of this study are clear:  During the winter and spring period when field N and P losses can be high, rye cover crops show great potential to mitigate negative environmental effects. The rye accumulated much greater biomass than oats in the fall, providing better winter cover to reduce runoff, erosion, and P loss potential. Rye also had a very strong positive impact on reducing nitrate leaching in the soil profile, as nitrate concentrations at 20 inch depth were extremely low throughout the sampling period. Oats showed no improvements in reducing nitrate leaching compared to the no-cover crop option.

Rye did not show reduced nitrous oxide emissions resulting from a simulated heavy rainfall event in early April, but showed a 70% decrease later in the month when it was actively taking up N and producing biomass. Oats had winter killed and therefore averaged consistently high emissions throughout the spring period.

In all, the rye cover crop had significantly greater positive effects in terms of reducing P and N loss potentials, while the benefits of the oats were minimal. Although results may vary seasonally, the winter hardy rye cover crop should be given strong preference over oats when the primary objective is to reduce nutrient losses to the environment.

Acknowledgements:  This research was supported through a grant from the USDA Northeast Region Sustainable Agriculture Research and Education program.  We are grateful for the collaboration of John Fleming of Hardie Farms in Lansing, NY.

Winter-Forage Small Grains to Boost Feed Supply: Not Just a Cover Crop Anymore!

Tom Kilcer1,2, Shona Ort1, Quirine Ketterings1, and Karl Czymmek1,3
1Nutrient Management Spear Program, Dept. of Animal Science, Cornell University, 2Advanced Ag Systems, 3PRODAIRY, Dept. of Animal Science, Cornell University

Many NY dairies will need to rebuild forage inventory going in to 2013. Some farms are starting to take advantage of winter grains for spring harvest before corn planting. Properly managed, these crops can supply 2-4 tons of dry matter per acre (table 1), and in some fields in 2012 we measured up to 5 tons of dry matter of high quality forage from small grains planted after corn silage, even with little growth in the fall.

Table 1: Biomass fall and spring for winter cereals seeded in fall 2011 at locations across New York State. Since these are not side by side comparisons in the same field, the averages illustrate yield ranges and should not be compared directly to each other.

Crop: The main options are winter wheat, cereal rye or winter triticale. In 2011, we measured yields on all three species in a trial at the Valatie Research Farm in eastern NY and the results were very similar (2.31, 1.92, and 1.96 tons DM/acre for rye, triticale and wheat, respectively, sampled at optimal harvest time for forage. The data for 2012 are shown in Table 2. Triticale yielded between rye (highest biomass) and wheat (lowest biomass) consistently in both years. Triticale is very resistant to lodging when harvested for forage and has the best nutrition profile of the three crops.

Figure 1: A late planted crop can still generate high quality and high yielding forage in the spring. The pictures show triticale at one of the western NY sites in fall of 2011 (left; 0.2 tons DM/acre December 14, 2011) and at harvest time (right; 2.0 tons DM/acre May 11, 2012).

Planting:
Winter grains are very well suited to no-till and will do nicely with a coat of manure after corn silage. Planting with a grain drill or air seeder is the best option to assure a good stand and to maximize value from certified seed. The crop should be planted as soon after corn silage as possible, ideally, mid-late September. The comparison at the Valatie Research Farm suggest that earlier planting produces significantly higher biomass in the fall followed by high forage yields in the spring. However, all cereals produced more than 2.5 tons/acre DM (more than 7 tons/acre silage equivalent) even when seeded in October and with very little fall biomass production (Table 2). The later the planting the more critical the seed be placed 1 – 1.5 inches deep to prevent spring heaving from decimating the stand.

Table 2: Yield for fall seeded winter cereals grown as cover/double crop at the Valatie Research Farm. Seeding took place 10/5/2012 or 9/16/2012. The above ground biomass was harvested 5/2/2012.

Fertilization:
Fields with a manure history and a coat of manure applied after corn silage before, with, or shortly after planting will not need any starter fertilizer in most circumstances. For optimum yield, the crop could need some available N (supplied by fertilizer – e.g. UAN or urea) when dormancy breaks in the spring. We have seen applications in the range of 50-100 pounds of actual N work well. We will be doing more testing to hone in on a spring N guideline and invite farmers to participate in on-farm trials in the spring of 2013 to determine how much fertilizer N is needed for optimal economic yield.

Harvest:
Flag leaf stage supports very high milk production with good yields. More biomass will be added through early head emergence, so harvest timing will depend on farm goals and weather conditions.

Bottom line:
Winter small grains are easy to grow and when harvested for forage in spring make excellent feed and can provide a significant boost to forage inventories. Act now to a secure seed supply. 


Alfalfa Fall Harvest Guidelines in NY – Should They Change?

J.H. Cherney, D.J.R. Cherney, and P.R. Peterson, Cornell University

Fall harvest management is one of the factors affecting the ability of alfalfa to overwinter successfully. Other factors include the age of the stand, the winter hardiness and disease ratings of the cultivar, the length of cutting intervals throughout the season, soil pH, soil K level, soil drainage, and whether growth is left to catch snow. Once we have planted a stand of alfalfa or alfalfa-grass, the primary two persistence factors we can control are soil K level and fall cutting management.

Good Old Days
For a number of decades, the policy for alfalfa fall harvest was to insist on a no-cut fall rest period of 4-6 weeks before the first killing frost. This critical fall period allowed root reserves to be replenished and minimized the chances that cutting management would negatively impact overwintering. Adequate time to replenish root reserves was considered 10% bloom by some researchers, while others assumed that 8-10” of top growth in the fall assured maximum root reserve storage, prior to the first killing frost. It also left significant alfalfa residue to facilitate insulating snow catch.

What is a “Killing Frost”?
The temperature at which alfalfa essentially stops all growth is somewhere between 24 and 28o F. Sheaffer (MN) suggested the first killing frost was 28o F, Tesar (MI) considered it 26.6o F (-3o C), while Undersander (WI) considered a killing frost as 4 or more hours at 24o F. Other studies have used 25o F as the definition of first killing frost. This can greatly impact the date of “first killing frost”. In Ithaca, NY for example, the latest “first killing frost” date for 30 years of weather data occurred Nov. 5 at 28o F vs. Dec. 10 at 25o F. When accumulating Growing Degree Days (GDD) until first killing frost, a low temperature such as 25o F is not reasonable, as all alfalfa varieties with appropriate winter hardiness ratings for the region would have gone dormant well before Dec. 10.

Fall Alfalfa Harvest Management, 1980’s
During the 1980’s, numerous studies in Canada and the northern USA investigated alfalfa fall harvest management. Research in southern Saskatchewan found that a third cut between Aug. 25 and Sep. 20 reduced spring yields, compared to an Oct. 1 cut. McKenzie et al. (1980) determined that a second cut from Aug. to mid-Sep. consistently reduced future yields in central Alberta, but not in northern Alberta. In Minnesota, Marten (1980) concluded that a third harvest anytime in September would not reduce persistence, assuming it was a winter hardy variety on well-drained soils high in K, and there was consistent snow cover. In Michigan, Tesar (1981) also concluded that a third cut in September or early October was not harmful.

Tesar and Yager (1985) suggested that a third cut in September in the northern USA was not harmful as long as there was adequate time for replenishment of carbohydrate reserves between the second and third cuttings. Sheaffer et al. (1986) concluded that fall cutting does increase the risk of long-term stand loss, but that fall cutting will provide short-term higher yields and high quality. They also concluded that length of harvest interval and number of harvests during the growing season were as important as the final harvest date.

Root Reserves Assessed with GDD
The first attempt to quantify carbohydrate reserves between second and third cuttings of alfalfa based on GDD occurred in Canada. Research in Quebec by Belanger et al. showed that it may be acceptable to cut during the critical fall rest period in September, as long as there was an interval of approximately 500 GDD (base 5o C) between the fall harvest and the previous harvest. For forage crops in the USA, GDD are calculated using base41, with heat units accumulated above a daily average of 41o F (5o C). These do not generate the same number of GDD units, 500 GDD base5 C is equal to 900 GDD base41 F.

Current NY Guidelines
The sum of the above research results caused NY fall alfalfa harvest recommendations to change about 20 years ago to “Allow a rest period of 6 to 7 weeks between the last two cuts”. A similar recommendation in PA of “At least 45 days between the last two cuts” was also adopted. This recommendation has not changed in NY for the past 20 years. Keep in mind that any cutting management options during the critical fall rest period must involve healthy stands of better adapted winter hardy varieties with multiple pest resistance.

Application of the 500 GDD Criteria
A comparison of the Quebec 500 GDD base5 C rest period can be made with the currently recommended “6-7 week rest period”. By selecting the years with the least and most GDD accumulated during August and September, a range in days for the rest period can be calculated, based on a 500 GDD interval between the last two cuts (Fig. 1 & 2). If cutting on Sep. 1, the 500 GDD interval prior to Sep. 1 is about 5 weeks (Table 1). If cutting Sep. 30, the 500 GDD interval prior to Sep. 30 is 6 to 7 weeks. The rate of decline in GDD units per day in the fall is similar for central and northern NY (Fig. 3 & 4; Table 1).

All X- and Y-axis date combinations below the shaded boxes in Fig. 1 and 2 identify the rest period interval that will result in 500 GDD before the September cut with high confidence. These date combinations resulted in 500 GDD for all 30 years of weather data. All X- and Y-axis date combinations above the shaded box in Fig. 1 and 2 will be very unlikely to accumulate 500 GDD, as this never happened in 30 years. For example, in Ithaca (Fig. 1) if alfalfa is cut on Aug. 2, it is Sept. 12 before you are out of the rest period shaded zone. Using the 500 GDD concept, our current 6-7 week rest period is appropriate for cutting at the end of September, but could be reduced to approximately a 5 week rest period if cutting Sep. 1. For rest periods based on GDD, the later it is in the season, the longer it will take to accumulate 500 GDD (Fig. 3 & 4).

Applying the 500 GDD Interval to the Critical Fall Rest Period before 1st Frost
It has been suggested to apply the Quebec research to the period preceding 1st frost, and help define a “no-cut” time interval prior to 1st frost. The assumptions are that we need 500 GDD (base5 C) for alfalfa to build up root reserves. A second assumption is that it is safe to cut alfalfa if there are less than 200 GDD (base5 C) remaining before the first killing frost, as there would be insufficient regrowth to use up enough storage carbohydrates to negatively affect alfalfa persistence. We are presenting this system as an example, even though we were not able to find any evidence in the scientific literature concerning the 200 GDD assumption. A similar example of this concept can be found in Michigan literature (http://www.agweather.geo.msu.edu/agwx/articles/article-09.html), although GDD base41 were used for this example incorrectly. Using the 500/200 GDD criteria, we can approximate the odds that fall mowing will not cause winter injury.

Approximate probabilities of either accumulating over 500 GDD (base5 C) or accumulating less than 200 GDD (base5 C), with long-term weather data (30 consecutive years) can be calculated if alfalfa is cut on a particular date in the fall at a particular site (Fig. 5 & 6). Four dates can be determined to approximate 0 and 100% chances of either more than 500 GDD after fall cutting, or less than 200 GDD after fall cutting. For this exercise, we are assuming that the first occurrence of 28o F is a “killing frost”. A killing frost in Watertown occurs on average 9 days earlier than in Ithaca (Table 1).

Four dates, (a,b,c,d, Fig. 5 & 6) are identified by calculating the following:
a. Year with earliest killing frost date: subtract 500 GDD base5 C (from Sep. 20, 1993).
b. Year with latest killing frost date: subtract 200 GDD base5 C (from Oct. 28, 2001).
c. Year with latest killing frost date: subtract 500 GDD base5 C (from Oct. 28, 2001).
d. Year with earliest killing frost date: subtract 200 GDD base5 C (from Sep. 20, 1993).

For long term weather data, these dates correspond to:
a. Latest calendar date resulting in >500 GDD base5 C after fall cutting.
b. Earliest calendar date resulting in <200 GDD base5 C after fall cutting.
c. Earliest calendar date resulting in <500 GDD base5 C after fall cutting.
d. Latest calendar date resulting in >200 GDD base5 C after fall cutting.

To simplify the display, we then assume a linear relationship between 0% and 100% chances that fall cutting will not cause winter injury. Statistical probabilities could be calculated individually for each day, but the results would not provide clear guidelines. The rate of GDD accumulation into the fall gradually decreases and is not perfectly linear (Fig. 3 & 4), but for practical purposes a linear display suffices. Cutting on Aug. 31, Sep. 1, or Sep. 2, the odds of either accumulating >500 GDD or accumulating <200 GDD in Watertown, NY are approximately zero. Using this system, the date that would maximize the chances of winter injury due to cutting is Sep. 1 in Watertown, and Sep. 6 in Ithaca.

Comparing the Systems
Compare Fig. 4 (interval to 1st frost) to Fig. 2 (interval between last two cuts). If alfalfa was mowed on July 25, and then mowed again on Sep. 1 in Watertown, the chances of winter injury due to cutting are near zero for Fig. 2 (with 500 GDD accumulated between the last two cuts all 30 years). So under one system (Fig. 4), Sep. 1 would be the worst date to cut alfalfa in Watertown, while under the other system (Fig. 2), Sep. 1 can be a very safe date to cut alfalfa.

It is possible that both systems are reasonable. Allowing a 500 GDD interval before a Sep. 1 cut would make a Sep. 1 cut relatively safe. On the other hand, not allowing 500 GDD before a Sep. 1 cut might make this the worst possible time to cut an alfalfa stand. Keep in mind that winter damage to alfalfa is an accumulation of insults. A weakened stand will be considerably more susceptible to damage from intensive harvest management, as well as mowing during the critical fall rest period.

Reasons to be more Conservative in NY vs. the Midwest
There are several issues more specific to the Northeast/New England, which will likely have an impact on the chances of fall cutting affecting long-term alfalfa persistence. The basic requirement for any cutting of alfalfa during the critical fall period is that near ideal conditions exist. That is, you have a healthy, very winter hardy variety with high soil K, good soil drainage, and good snow cover over the winter. Good soil drainage in NY is often not the case, and consistent snow cover is never guaranteed. In northern NY there is also the possibility of alfalfa snout beetle and/or brown root rot damage, which could greatly affect the consequences of cutting during the fall period.

Reasons to be less Conservative in NY vs. the Midwest
Another NY-specific issue is that of species mixtures. Most alfalfa in the Midwest is sown in pure stands, over 85% of alfalfa sown in NY is in mixture with perennial grasses. For mixed stands with alfalfa, growers may be somewhat less risk averse than with pure stands, when it comes to the chances that fall cutting will result in shortened persistence of the alfalfa component. Loosing alfalfa more quickly from a mixed stand is not quite as catastrophic as loosing alfalfa in a pure stand. With the availability of Round-up Ready alfalfa, the frequency of pure alfalfa stands in the Midwest is likely to increase. Because NY has few prime alfalfa soils, it is less likely that RR-alfalfa will greatly increase the proportion of pure alfalfa stands in NY.

Conclusions
Our historical understanding of alfalfa root reserves provides evidence for maintaining a Critical Fall Rest Period for alfalfa. Applying the 500 GDD criteria to the Critical Fall Rest Period, however, results in an average rest period before 1st killing frost exceeding 7 weeks. Past research data provide evidence that a sufficient rest interval between the last two cuts allows us to take the last cut during the critical rest period. There does not appear to be evidence to change our basic logic for fall harvest of alfalfa. Some fine tuning of the rest interval between the last two cuts can be made using Fig. 1 and 2. The above suggestions are for healthy stands. If a stand is not healthy, a more conservative harvest management may increase the chances of stand survival.