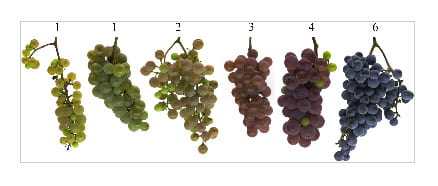
A wide range of berry color was observed in the 140 F1 vines of GE1025, a sample of which are shown above with their corresponding OIV color ratings.
Evaluating and mapping grape color using image-based phenotyping
Authors: Anna Underhill, Cory Hirsch, Matthew Clark
Plant Phenomics. 2020, Article ID 8086309 DOI:10.34133/2020/8086309.
Summary by Anna Underhill
The Takeaway.
- To measure berry color in a more quantitative way, images of grape clusters were captured after harvest and segmented based on color.
- Using several different color spaces (RGB, HSI, and L*a*b*), berry color values were collected and assessed against genetic data in quantitative trait loci (QTL) mapping.
- Color values collected from images were closely associated with known color genes, and with previously unreported loci that may represent areas of the genome influencing berry color.

The parents of the GE1025 population: MN1264 and MN1246 are wine grape selections from the University of Minnesota. Their diverse background (including ancestry in at least six Vitis species) produced a segregating population for use in genetic mapping of color.
Background. Grape berry color is an economically important trait that is often a breeding target for wine and table grapes alike. Color is primarily determined by anthocyanins – organic pigments that give fruits and vegetables their hues – and environmental variables, like heat and sunlight, during fruit development. In grape, color is simply inherited: that is, two genes determine whether a grape is noir (dark blue or black) or non-noir (violet, red, pink, or green). However, these two genes are not the sole determinants of berry color; several studies have linked other genetic regions to color variation in grape.
Traditionally, berry color has been evaluated visually using a scale developed by the International Organisation of Vine and Wine (OIV). This scale – ranging from 6, blue-black, to 1, green – provides a simple way to categorize fruit with your eyes. However, this method has several drawbacks: for example, how do you know everyone who rates the fruit will do it in the same way? If you are evaluating a population in which the fruit is all similarly colored, will you be able to capture all the variation you observe? This research sought to use a more objective method to measure color and to determine if such a method produced informative data for genetic mapping.
Experiment. This work was performed in a diverse F1 population, GE1025, which was derived from a cross between two University of Minnesota wine grape selections (MN1264 × MN1246). With a noir maternal parent (MN1264) and a non-noir paternal parent (MN1246), GE1025 vines segregated widely for fruit color. At harvest, three clusters from each of the vines were collected and imaged from four different angles. Images were segmented based on their color – with background, berries, and stem each separated into different classes – and the average color of the berries was quantified using the RGB, HSI, and L*a*b* color spaces.
The color data collected from imaging across two years was used for quantitative trait loci (QTL) mapping. By combining color data with genetic marker data, associations between color – the phenotype – and regions of the genome were tested. If a certain genetic region was linked to a component of visual color, the strength of this association and its impact could be examined.
Results. Image-based color measurement was effective. Capturing images of fruit and then segmenting them based on color proved to be a simple way to measure berry color in a more exact fashion. Principal component analysis showed that while each color space could be used to quantify color, RGB and HSI values had a greater ability to distinguish between noir fruit colors.
Genetic regions influencing color were identified. When berry color was quantified and mapped, many of the color components were significantly associated with the two major color genes, VvMYBA1 and VvMYBA2, on chromosome 2 of the maternal parent. Several other loci on the genome, namely on maternal chromosomes 1 and 6 and on paternal chromosome 2, were also associated with components of visual color. Some loci were in locations of known anthocyanin synthesis genes, while others had been previously reported in studies of grape anthocyanin composition. Other loci in this study have not yet been reported, which suggests they may be new regions of interest for control of berry color.
Conclusions and practical considerations. This research confirmed that an image-based color capture system can identify the same important genes as when a visual rating system is used. Additionally, several loci that were identified may have minor impacts on fruit color, demonstrating that images can capture more variability within a population. Together, these results demonstrate the advantages of this relatively simple system for use in breeding or research programs where fruit color is a trait of interest.
Anna Underhill is a Biological Science Research Technician in the USDA-ARS Grape Genetics Research Unit in Geneva, NY, where she focuses on image analysis systems for disease quantification.