“There is a lot of chatter in the dairy press recently about another month of negative PPDs, including a lot of statements to the effect that there is a bunch of money being deducted from farmer’s milk checks.
Money comes into the pool from buyers of milk, who are obliged to pay the minimum Class I, Class II, Class III, and Class IV prices, based on the relative amounts of cream and skim milk that they use to produce their product. Each component has a different price as well as differences between the classes. Classes I, II, and IV are charged according to milkfat content and total skim solids (protein and carbohydrate combined). Class III is the only class that charges buyers according to milkfat, protein, and “other solids”.
Money goes out of the pool differently than it comes in.
The first step is to say, let’s pay all farmers in accord with the Class III prices for components. We do this simply because we decided that farmer pay prices should incentivize protein, even though cheese makers are the only ones that have to pay for protein, per se. Once you start with the Class III price as the first step in calculating a minimum farm price for milk, the next step is to see if there is any money left over (which normally there would be because Class I is charged a higher price – as a general rule). If there is money left in the bucket after you’ve pulled out the Class III value, that money becomes the PPD and is pro-rated to all farmers with the only adjustments being for location – higher towards the coast, lower as you move away. When you have a negative PPD, that means that taking the Class III value out of the pool results in a negative value, you took out more money out than was in the bucket to begin with. A negative PPD restores that deficit until the bucket is just empty.
The only reason why there is a negative PPD is because our first guess at the minimum blend price – the Class III price – is too high.
Another piece of this puzzle is to remember that Class I and II prices are announced in advance, and thus must be based on Class III and IV values from before the “current” month. Class III and IV prices for the “current” month aren’t announced until that month is complete. The last column in the table below shows the differences between the Class I price in Syracuse and the Class III price. The positive numbers are when the PPD is positive (keep in mind the PPD is the difference between Class III and Blend, not Class I). The big negative numbers for June and July are the indication that there isn’t any Class I value to put on top of the Class III price for those two months. Indeed it is just the opposite. The implication of this is that, contrary to what we normally expect, in these months cheese makers are subsidizing fluid milk processors so that fluid milk processors can afford to pay a blend price that is higher than their Class I price.
Back when Class I milk prices were built on top of whichever of the Class III or IV prices was higher, the only way one could get a negative PPD is if 1) the Class III price was the “higher of” and 2) it skyrocketed between the value that was used to peg the Class I price in the “current” month and the actual Class III price that applies to Class III milk purchased in the current month. In other words, a negative PPD occurs when there is a big jump in the Class III price in one month. That is exactly what happened in June.
The story for July is a bit different. There was no big jump in the Class III price for July compared to June (a sizable but not gigantic jump). Rather what got us the negative PPD in July results more from a change that the National Milk Producers Federation and the International Dairy Processors Association persuaded Congress to enact as part of the last farm bill. Since then, the Class I price has been built on top of the average of the Class III and IV price, plus 74¢. When there is a very large gap between the Class IV and Class III prices, then the difference between the average and whichever happens to be higher will exceed the 74¢ adjuster. As I’ve noted in our paper on this topic, the 74¢ was based on an average of the historical differences between the average of the two class prices and the “higher of”. While the designers recognized that there would be periods where the actual difference was more than 74¢, they felt it would balance out with those months where the gap was lower (as averages do) but they never imagined a gap as large as we’ve seen in June and July. See the second column from the right for those differences.
| Class I Base Price | FO 1 Class I Price, Syracuse | Class II | Class III | Class IV | Ave Class III & IV + 74¢ | Class III – mover | FO1 Class I SYR-Class III | |
| JAN | $ 19.01 | $ 21.51 | $ 17.05 | $ 17.05 | $ 16.65 | $ 17.59 | $ (0.54) | $ 4.46 |
| FEB | $ 17.55 | $ 20.05 | $ 16.84 | $ 17.00 | $ 16.20 | $ 17.34 | $ (0.34) | $ 3.05 |
| MAR | $ 17.46 | $ 19.96 | $ 16.75 | $ 16.25 | $ 14.87 | $ 16.30 | $ (0.05) | $ 3.71 |
| APR | $ 16.64 | $ 19.14 | $ 13.87 | $ 13.07 | $ 11.40 | $ 12.98 | $ 0.10 | $ 6.07 |
| MAY | $ 12.95 | $ 15.45 | $ 12.30 | $ 12.14 | $ 10.67 | $ 12.15 | $ (0.01) | $ 3.31 |
| JUN | $ 11.42 | $ 13.92 | $ 12.99 | $ 21.04 | $ 12.90 | $ 17.71 | $ 3.33 | $ (7.12) |
| JUL | $ 16.56 | $ 19.06 | $ 13.79 | $ 24.54 | $ 13.76 | $ 19.89 | $ 4.65 | $ (5.48) |
| AUG | $ 19.78 | $ 22.28 | $ 14.45 | |||||
| SEP | $ 18.44 | $ 20.94 | $ 10.60 |
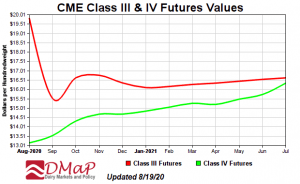
By the way, this gap is expected to narrow dramatically as the Class III price is collapsing towards the Class IV price on futures markets. The good news is that this will result in less confusing blend price arithmetic. The bad news is that the net milk price for farmers is going to suck.
The Class III price is just the starting point in calculating a blend price.”
The E.V. Baker Professor of Agricultural Economics Emeritus
Charles H. Dyson School of Applied Economics and Management
SC Johnson College of Business
Cornell University

