Networks and the Farey Diagram
As one may have suspected, the study of simple networks and graph theory overlap substantially. Both incorporate abstract diagrams to better represent practical and sometimes theoretical constructs researchers encounter. Mathematicians have increasingly found that representing an analytic relation graphically (or through networks) greatly simplifies the subject of study – as we will see in the following example.
In the early 1800’s an English geologist and recreational mathematician by the name of John Farey began to examine the famous sequence which caries his name. From wikipedia, “the Farey sequence of order n is the sequence of completely reduced fractions between 0 and 1 which, when in lowest terms, have less than or equal to n, arranged in order of increasing size”. For instance, the first 3 and 7th orders would be
F1 = {0⁄1, 1⁄1}
F2 = {0⁄1, 1⁄2, 1⁄1}
F3 = {0⁄1, 1⁄3, 1⁄2, 2⁄3, 1⁄1} . . . . . .
F7 = {0⁄1, 1⁄7, 1⁄6, 1⁄5, 1⁄4, 2⁄7, 1⁄3, 2⁄5, 3⁄7, 1⁄2, 4⁄7, 3⁄5, 2⁄3, 5⁄7, 3⁄4, 4⁄5, 5⁄6, 6⁄7, 1⁄1}
As one can see, this process soon becomes cumbersome as ‘n’ grows larger. Luckily, there is a much more elegant and clearer way to represent these relationships graphically, or through a network. Let’s start with a simple construction, where n = 7. We can build a recursive picture to represent this sequence, as seen below.

Note that every element or ‘node’ in this network is connected by an edge to the two elements which produced it recursively, with the exception of 0/1 and 1/1t – this creates a triadic structure which can be witnessed above. For instance, the node (5/7) was created recursively by taking the mediant of the two elements which rest directly above it (mediant of 2/3 and 3/4 is 5/7 [(2 + 3)/(3 + 4) = 5/7] ). This process can be repeated ad infinitum to create an infinite network connecting all rational numbers between 0 and 1.
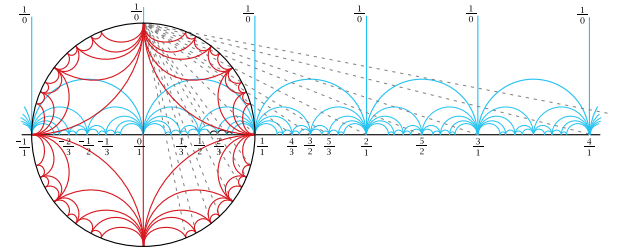
The above image is a rough outline of a much more elegant representation known as the Farey Diagram, which seeks to connect all rational numbers in one grand network/graph. This network is circular in structure, which more amply represents the nuances of this series. For starters, let us examine another way in which we could represent the Farey series when n = 5. 
All the nodes and edges are identical to the previous image but just expressed differently on a number line. It is now time to incorporate this information into the full Farey Diagram, whose construction we can see below.

So now we can see the general shape of diagram and how it’s constructed, let us now look at its form when n = 7.

I should now note that there are many interesting properties of this network which deserve more attention. For instance, repeating the mediant rule in some combination to infinity will produce irrational numbers. Thus, if we wanted to turn this into an infinite network for ‘n = inf’ we would have a network which would unite all rational and irrational numbers to some extent. Additionally, when two nodes share a connection we can put them into a matrix which will either have determinant +1 or -1 depending on the orientation. As an example (1/3) and (1/2) share an edge and the det( [1, 1 ; 2, 3]) = 3 – 2 = + 1.
This network grants the reader with a concrete understanding of rational numbers and the relationships they share with each other. I believe such a network gives new life to a possibly boring and mundane subject, revealing the inner beauty and order of mathematical objects. Diagrams such as these should be used to a greater extent in mathematical discussions and dialogues.
Source – http://www.math.cornell.edu/~hatcher/TN/TNch1.pdf (Awesome Chapter which deals with some basic topology of number theory, all credit to Prof. Allen Hatcher, also a great guy.)
-BPR