Brief Look at Network Flow
I attempt to model automobile transportation in the Ithaca area as a graph.
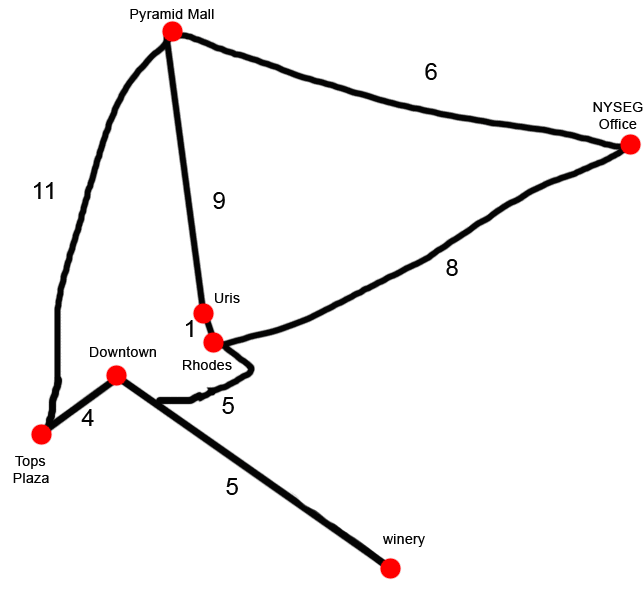
Figure 1: Current car travel graph for Ithaca, NY.
The nodes (shown as red dots) are large destinations that people often travel too. These are Uris Hall, Rhodes Hall, Downtown Ithaca, Tops Plaza on Meadow Street, Pyramid Mall, NYSEG office, and a winery.
The edges are the roads that connect nodes to each other. Each edge is bidirectional and has a cost (from 1 to 11) which indicates how many minutes it takes to traverse it. Note that the speed of the road is not shown, but can be inferred from the distance and edge cost.
Speed ∝ Distance/Cost
The lower speed limit is part of the reason why it takes five minutes to get from Rhodes Hall to Route 79, yet you can make it all the way from Downtown to the winery in the same amount of time.
We learned that a path was a listing of nodes from start to end. Similarly we can make a path from a given node to any other. This means the graph is connected. For example, a path from Rhodes Hall to Downtown Ithaca is: Rhodes Hall, Downtown Ithaca. Although the number of hops is low from one point to another, travel is inefficient due to small roads with low speed limits – speed limits between Cornell and downtown never exceed 30 miles per hour. As this is a well connected graph, the aforementioned path is not the only way to get from Rhodes Hall to Downtown. One could also take the following: Rhodes Hall, Uris Hall, Pyramid Mall, Tops Plaza, Downtown Ithaca.
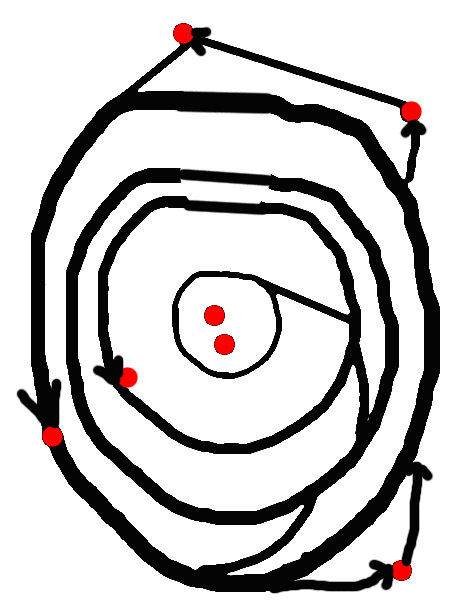
Rather I propose a more efficient graph shown by the concentric circles here.
These represent large unidirectional highways. People select the concentric circle according to their destination, and you can only change by using one of the interchanges shown. These are purposely placed in low traffic areas because traffic flow is disrupted when lanes merge. Although driving a longer distance, the travel is more fuel efficient (i.e. the cost of travel goes down) because all locations will be connected by a high speed superhighway. Imagine vehicles being able to travel in excess of a hundred miles per hour on the three circles. So people will be traveling longer distances, but in the end people will be happier to have spent less time waiting at stoplights or plodding along at 25 miles per hour.
In some sense this seems like a silly proposition because it would be cost prohibitive to build a large highway such as the one I have described. Consider it a rudimentary way of modeling traffic flow with graph theory.
There are some glaring concerns with this new graph. First it is more confusing. The beginning driver may have trouble finding the right circle and frustration ensues if he does not realize any two circles only connect at one point. Second if you start driving and need to turn around, you cannot. You need to go all the way around the circle. In addition it is important to see that this graph does not serve all locations. It is supposed to be used in conjunction with existing roads. Actually it is designed to have only a limited number of destinations. The more nodes you add to the graph the more slowdown and congestion occurs at the ramps that enter and exit the highway. Due to its specialized nature it would likely be a toll road for those who need comfortable and efficient motility on demand.


