Weekly UI Claims Still at Staggering Levels; New Unemployment Estimates Coming Tomorrow – Implications for New York State
7 May 2020
Earlier today, the U.S. Department of Labor (DOL) reported another 3.169 million initial unemployment insurance (UI) claims across the United States for the week ending 2 May 2020. That brings the total number of claims made since the last week of March – when the New York State COVID-19 PAUSE and nationwide stay-at-home orders went into effect – to nearly 33.5 million. To put that figure in perspective, the total national civilian labor force was estimated to be around 162.537 million workers in March 2020 (not seasonally adjusted). In other words, the number of UI claims made over the past seven weeks adds up to over one-fifth of the U.S. workforce.
These staggering, historic levels of UI claims have led to considerable speculation about what the current unemployment rate might be. Many analysts are predicting that the national unemployment rate – which measures the number of unemployed workers as a fraction of the civilian labor force – could reach between 18% and 20%. Such levels have not been seen since the Great Depression.
Tomorrow, 8 May 2020, we’ll get our first sense of whether these predictions are bearing out on the ground. Specifically, tomorrow the U.S. Census Bureau and the Bureau of Labor Statistics (BLS) are scheduled to release their Employment Situation report for April 2020. That report, based on surveys of business establishments and households, will provide estimates for several measures of labor underutilization – including the conventional unemployment rate – for the month of April. While the data for the report come from surveys conducted only through mid-April, and not the full month, the Employment Situation still offers a clearer and much more comprehensive picture of unemployment compared to weekly UI claims. Among other things, it will allow us to get a sense for the “overall share of employment that has ended or been suspended” due to COVID-19.
What might the report foretell about unemployment in New York State?
It goes without saying that the current state of the economy – and of the pandemic itself – is characterized by a high degree of uncertainty. As such, trying to predict what a jobs report might say is a difficult task. Still, many observers have gone on record to say that they expect New York’s statewide unemployment rate for April 2020 to reach somewhere between 13% and 15%.
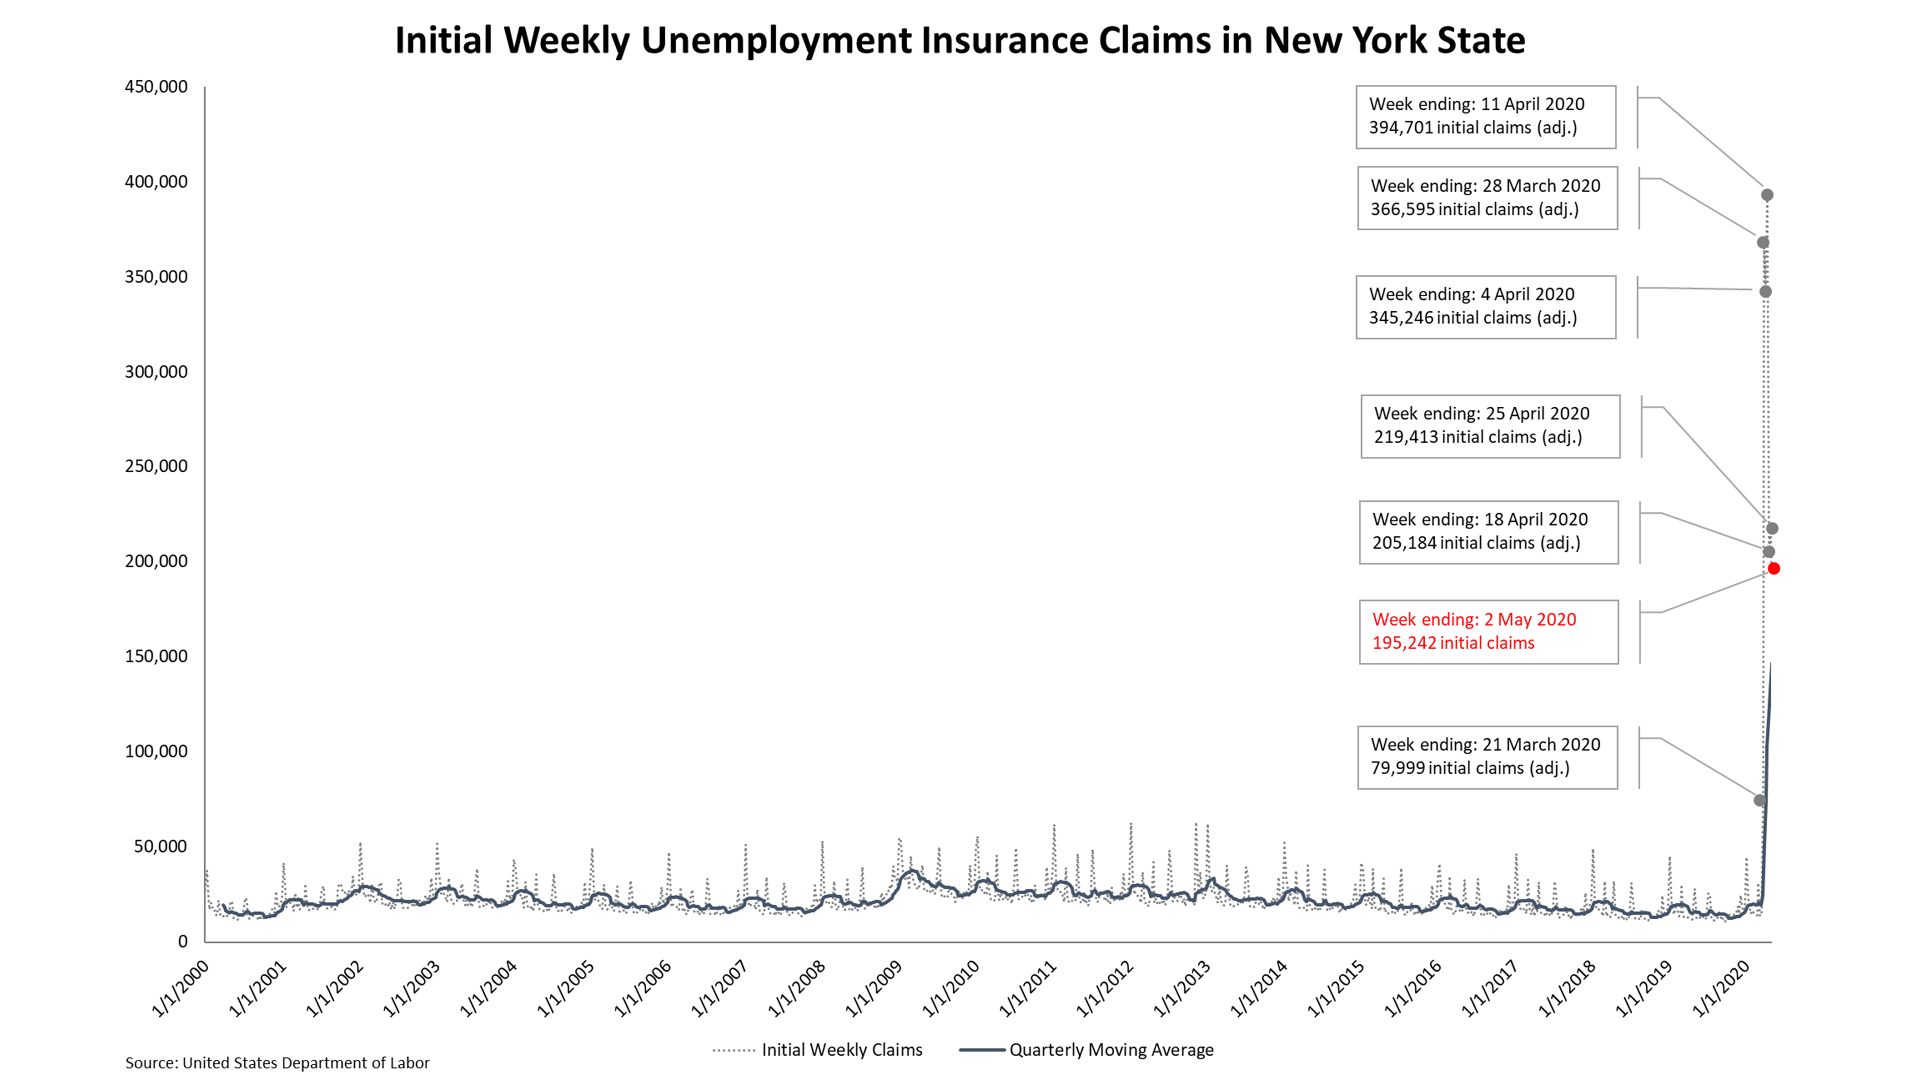
At the Cornell ILR Buffalo Co-Lab, we’ve been tracking weekly UI claims in New York State since the start of the pandemic. (Note: With another 195,000+ claims reported for the week ending 2 May 2020, the total number of COVID-related claims has now surpassed 1.8 million. See the table at the end of this post.) Our own models, which use temporal statistical methods to estimate the monthly New York State unemployment rate as a function of UI claims, suggest that statewide unemployment for April 2020 is likely to be, conservatively, around 12.5% to 13%. If we omit a large “influential observation” from the model – namely, March 2020 – that estimate jumps to between 15% and 15.5%.
Using a simple algorithm to break the estimated number of unemployed workers down by Labor Market Region, our results indicate that New York City (NYC) and Western New York (WNY) have been hit hardest so far. In the conservative scenario (i.e., a statewide unemployment rate between 12.5% and 13%), the estimated unemployment rates in NYC and WNY are between 13% and 14%. For comparison, the March 2020 unemployment rates in these LMRs were 4.2% and 5.4%, respectively.
Estimated April 2020 unemployment rate ranges in New York State, by Labor Market Region (LMR) – Conservative Scenario
| Estimated Unemployment Rate Ranges | LMRs in Range |
| 9.5% to less than 11% | Capitol Finger Lakes Hudson Valley |
| 11% to less than 13% | Southern Tier Mohawk Valley Long Island Central New York North Country |
| 13% or greater | New York City Western New York |
In the less conservative scenario (a statewide unemployment rate around 15%), our model implicates unemployment rates in NYC and WNY of roughly 17%. The lowest regional rate in this scenario is 12% in Capitol region.
Estimated April 2020 unemployment rate ranges in New York State, by Labor Market Region (LMR) – Less Conservative Scenario
| Estimated Unemployment Rate Ranges | LMRs in Range |
| 12% to less than 14% | Capitol Finger Lakes Hudson Valley |
| 14% to less than 16% | Southern Tier Mohawk Valley Long Island Central New York North Country |
| 16% or greater | New York City Western New York |
Once again, trying to predict economic numbers during a pandemic is no simple task given the degree of uncertainty involved. As such, the numbers from above should be considered preliminary and taken with the appropriate amount caution. Tomorrow’s data release will begin to add some clarity to the national conversation. Even more clarity will come later in the month when the BLS releases its State Employment and Unemployment data and report for April 2020. Until then, three things can be said with certainty: (1) the magnitude of this crisis is unprecedented and, consequently, (2) all regions are being negatively impacted by it; however, (3) some regions (e.g., New York City and Western New York) appear to be experiencing greater impacts than others. The upshot is that our approach to recovery must be strong and unified, while still allowing the flexibility needed to catalyze and nurture place-based innovations and context-sensitive solutions.
Week-to-week changes in UI claims in the U.S. and New York State, since 21 March 2020
| Week Ending: | U.S. | % Change from Prior Week | New York State | % Change from Prior Week |
| 21 March 2020 | 3,307,000 | +1,072% | 79,999 | +461% |
| 28 March 2020 | 6,867,000** | +108% | 366,595 | +358% |
| 4 April 2020 | 6,615,000 | -4% | 344,451 | -6% |
| 11 April 2020 | 5,237,000 | -21% | 394,701** | +15% |
| 18 April 2020 | 4,442,000 | -15% | 205,184 | -48% |
| 25 April 2020 | 3,846,000 | -14% | 219,413 | +6% |
| 2 May 2020* | 3,169,000 | -18% | 195,242 | -11% |
| Total Initial Claims, 21 March – 2 May 2020 | 33,483,000 | 1,805,585 | ||
*Represents initial claims data – subject to adjustment **Indicates peak observed value