Housing and Income Profile of Households At Risk of Mass COVID-19 Layoffs: Rochester Edition
21 April 2020
Late last month, researchers at the NYU Furman Center released a dataset that grouped more than 500 occupations into two categories: (1) those that are most at-risk of mass layoffs or workplace closures due to COVID-19, and (2) those that are likely to be more resilient to the pandemic. Using that dataset, we recently offered preliminary answers to broad questions about who is at risk, where at-risk workers live, and how many at-risk workers depend on employer-provided health care throughout New York State. As a follow-up to that statewide analysis, we are now taking closer looks at individual Upstate metropolitan regions to provide stakeholders with data on the potential scale of COVID-19’s impacts on their local populations. The first of these regional profiles, presented below, features the Rochester metropolitan area, which consists of Livingston, Monroe, Ontario, Orleans, Wayne, and Yates Counties in the Finger Lakes region of New York State.
According to the most recent (2014-18) U.S. Census Bureau Five-Year American Community Survey (ACS), the Rochester metropolitan region is home to just under 530,000 civilian workers. Those workers are sorted into about 320,000 wage-earning households.
To delineate the universe of at-risk workers in the Rochester area using the Furman Center dataset, we first downloaded the Census Bureau’s Public Use Microdata Samples (PUMS) for the most recent ACS. Next, from the PUMS we selected out all civilian wage earners who live in households (as opposed to group quarters). We then joined the Furman Center job classifications to the PUMS data using detailed occupation codes. Finally, we applied Census Bureau-provided weights to the data to estimate the size of the at-risk workforce. Based on that process, we found that approximately 28% of workers – nearly 150,000 individuals – in the Rochester metro area work in at-risk occupations. Those at-risk workers are distributed into more than 116,000 households, or roughly 37% of all wage-earning households in the region.
Consistent with earlier findings, at-risk workers are disproportionately persons of color. As illustrated in the following table, persons of color make up just 18% of all workers in the region. But they account for nearly 24% of workers in at-risk jobs. The odds that such a disparity would occur by chance alone are less than one in one billion. African Americans are particularly overrepresented among at-risk workers. Despite accounting for only 8.3% of the workforce, they hold nearly 12% of at-risk jobs.
| Race | % of All Workers | % of At-Risk Workers |
| White (Not Hispanic or Latinx) | 82.0% | 76.4% |
| Black or African American (Not Hispanic or Latinx) | 8.3% | 11.8% |
| Hispanic or Latinx | 5.5% | 7.4% |
| Asian or Pacific Islander (Not Hispanic or Latinx) | 2.6% | 2.3% |
| Other Person of Color (Not Hispanic or Latinx) | 1.4% | 2.0% |
| American Indian or Alaska Native (Not Hispanic or Latinx) | 0.2% | 0.1% |
| All Persons of Color, Combined | 18.0% | 23.6% |
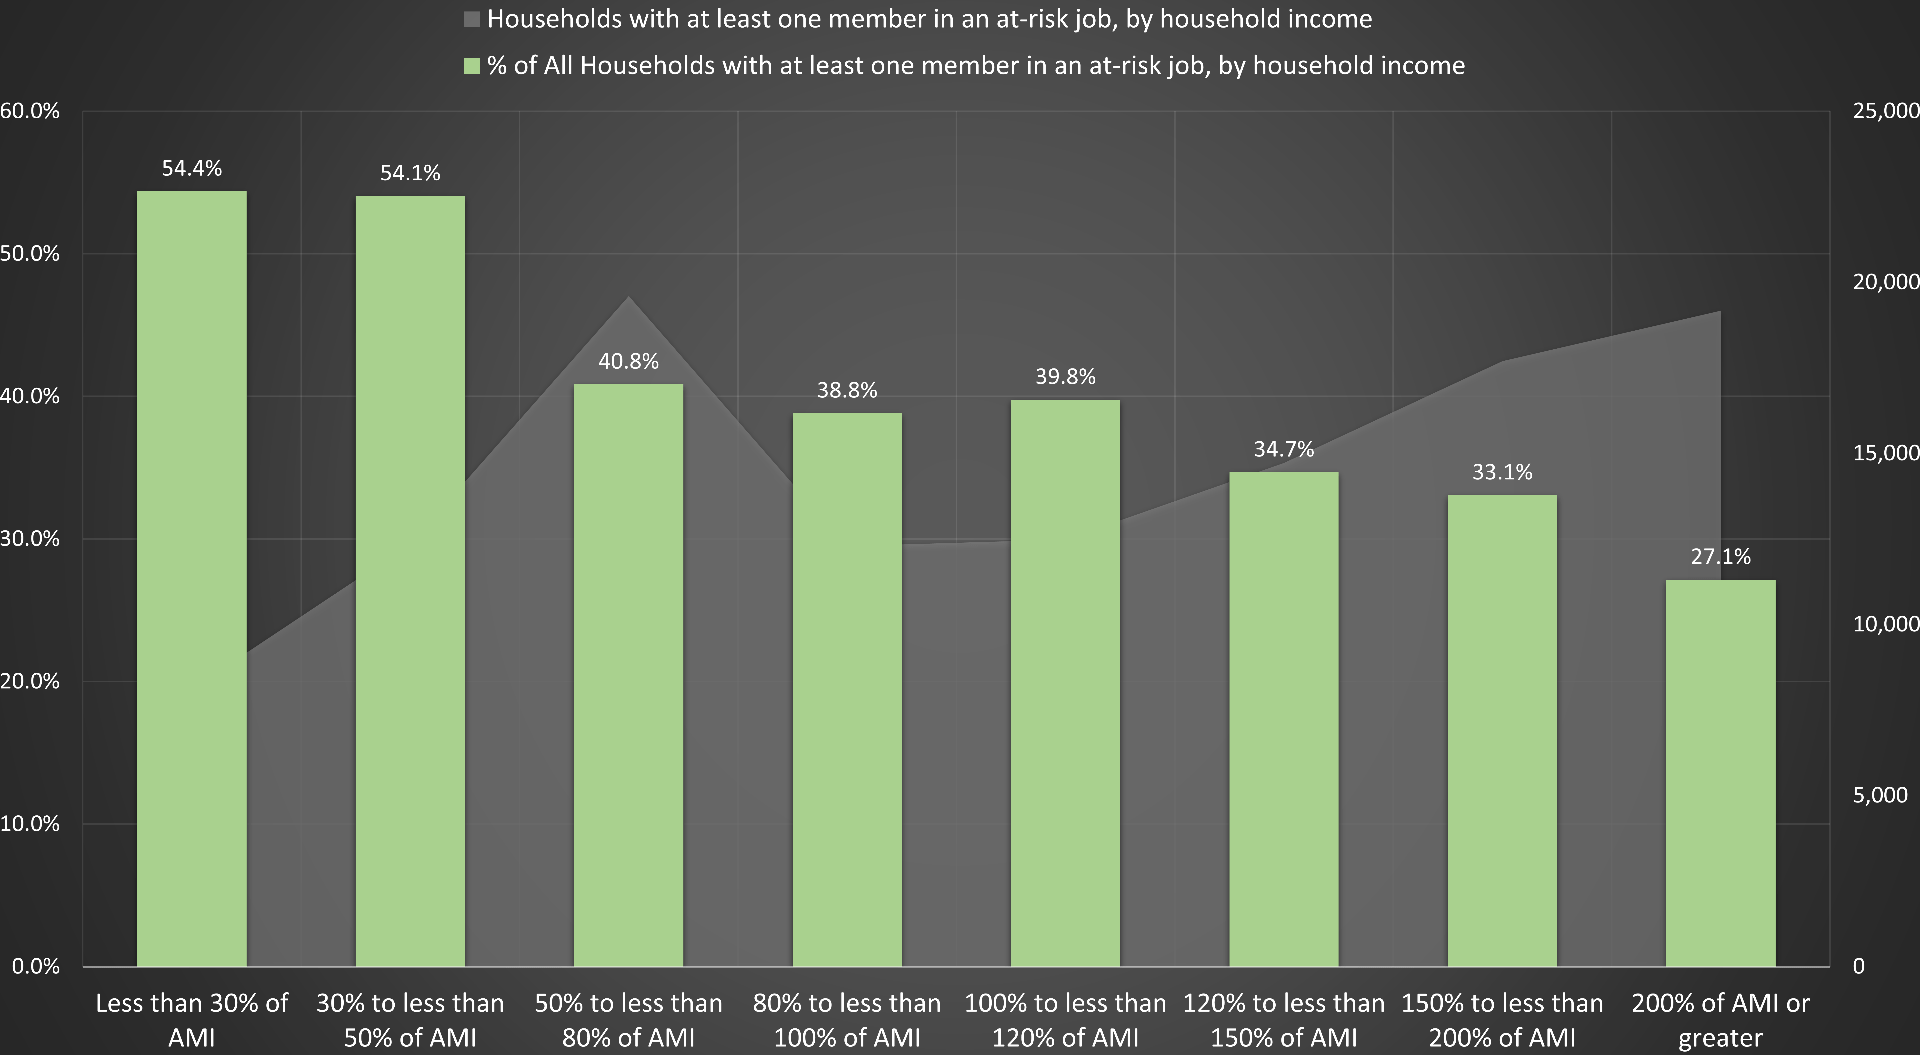
Intersecting with these disparities in at-risk work by race and ethnicity are alarming disparities by household income. More than half of the region’s lowest income households have at least one employed member in an at-risk occupation, compared to just over a quarter of the wealthiest households. More specifically, 54% of households with annual income below 50% of Rochester AMI (area median income, adjusted for household size) have a member in an at-risk occupation. For households earning more than double the regional AMI, that figure is only 27 percent.
Share of households with at least one member employed in an at-risk occupation, by household income
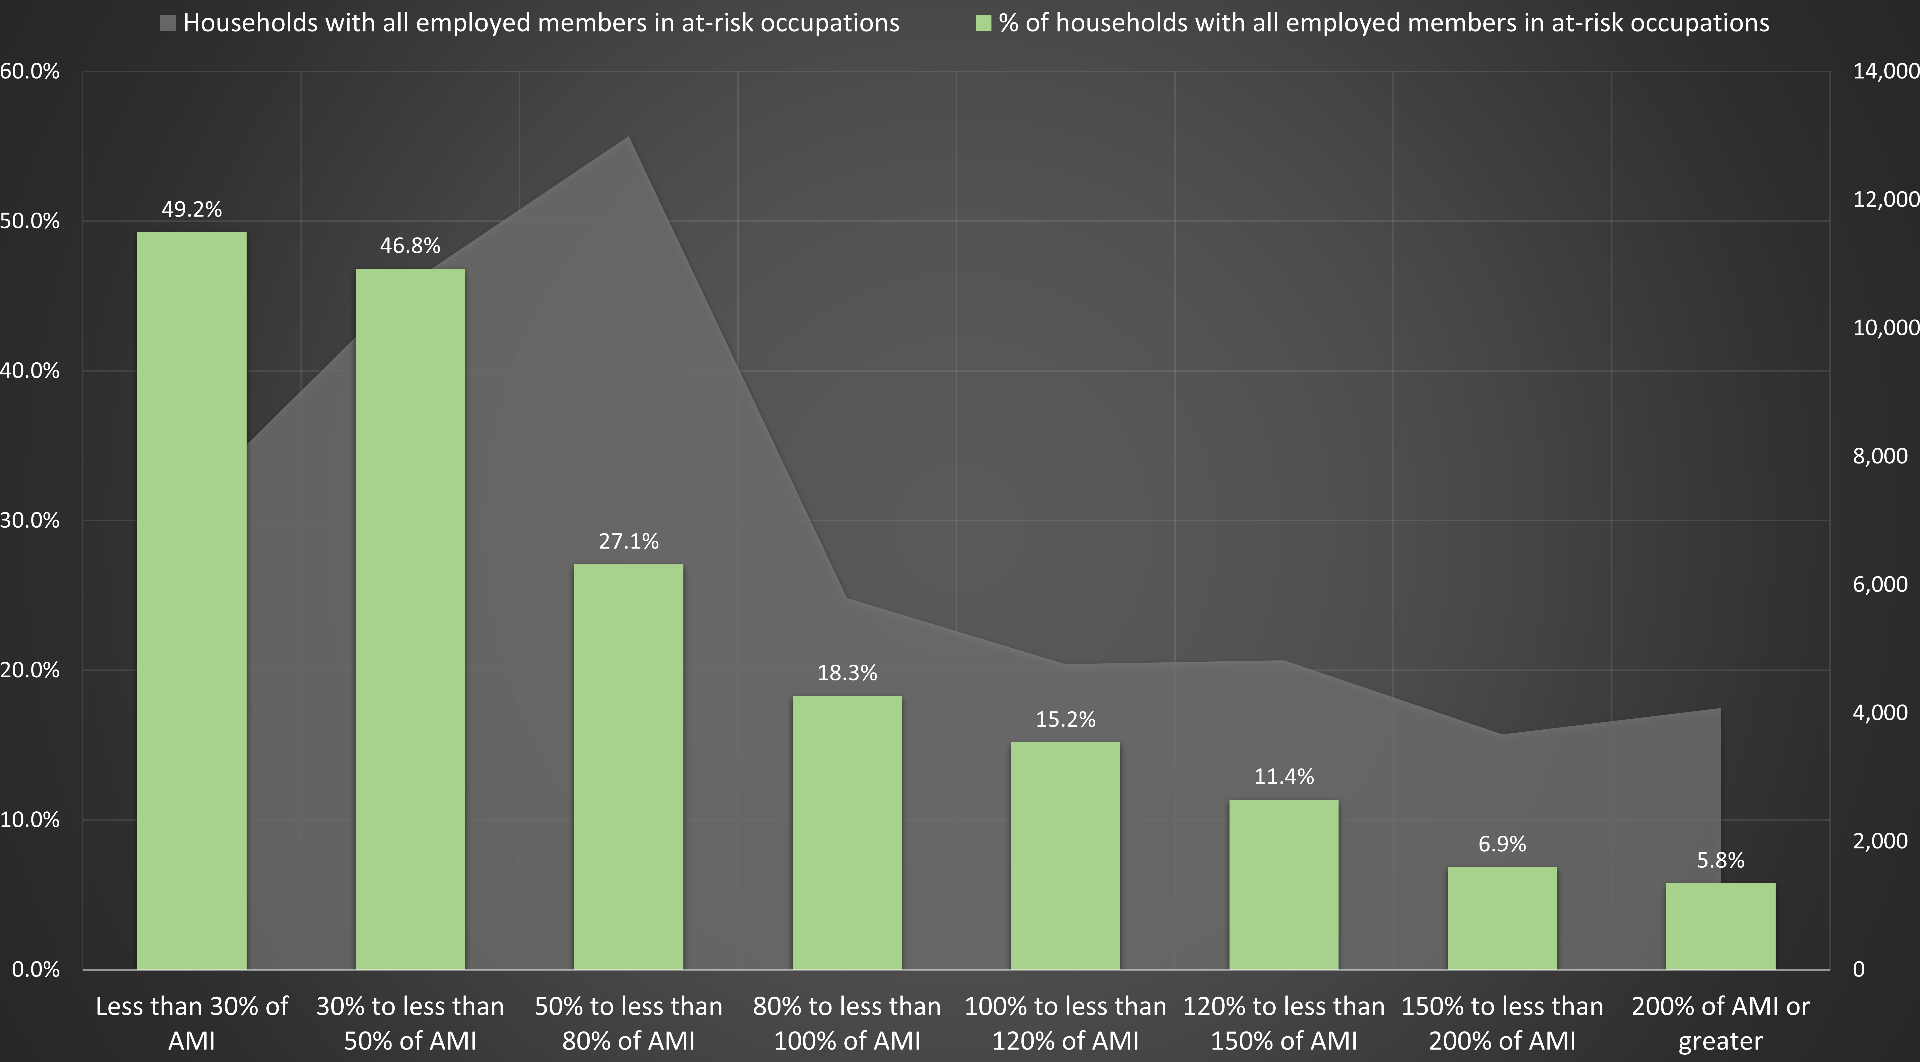
For 54,000-plus households in which all employed members work in at-risk occupations, the distribution is even more troubling. Consider that the United States Department of Housing and Urban Development (HUD) classifies households as “low-to-moderate” income when their annual income is less than 80% of AMI. By this measure, low-to-moderate income households account for roughly 27% of all wage-earning households in the Rochester metro. Yet they make up an astonishing 68% of households – nearly 37,000 households – in which all employed members work in at-risk occupations.
Share of households with all employed members in at-risk occupations, by household income
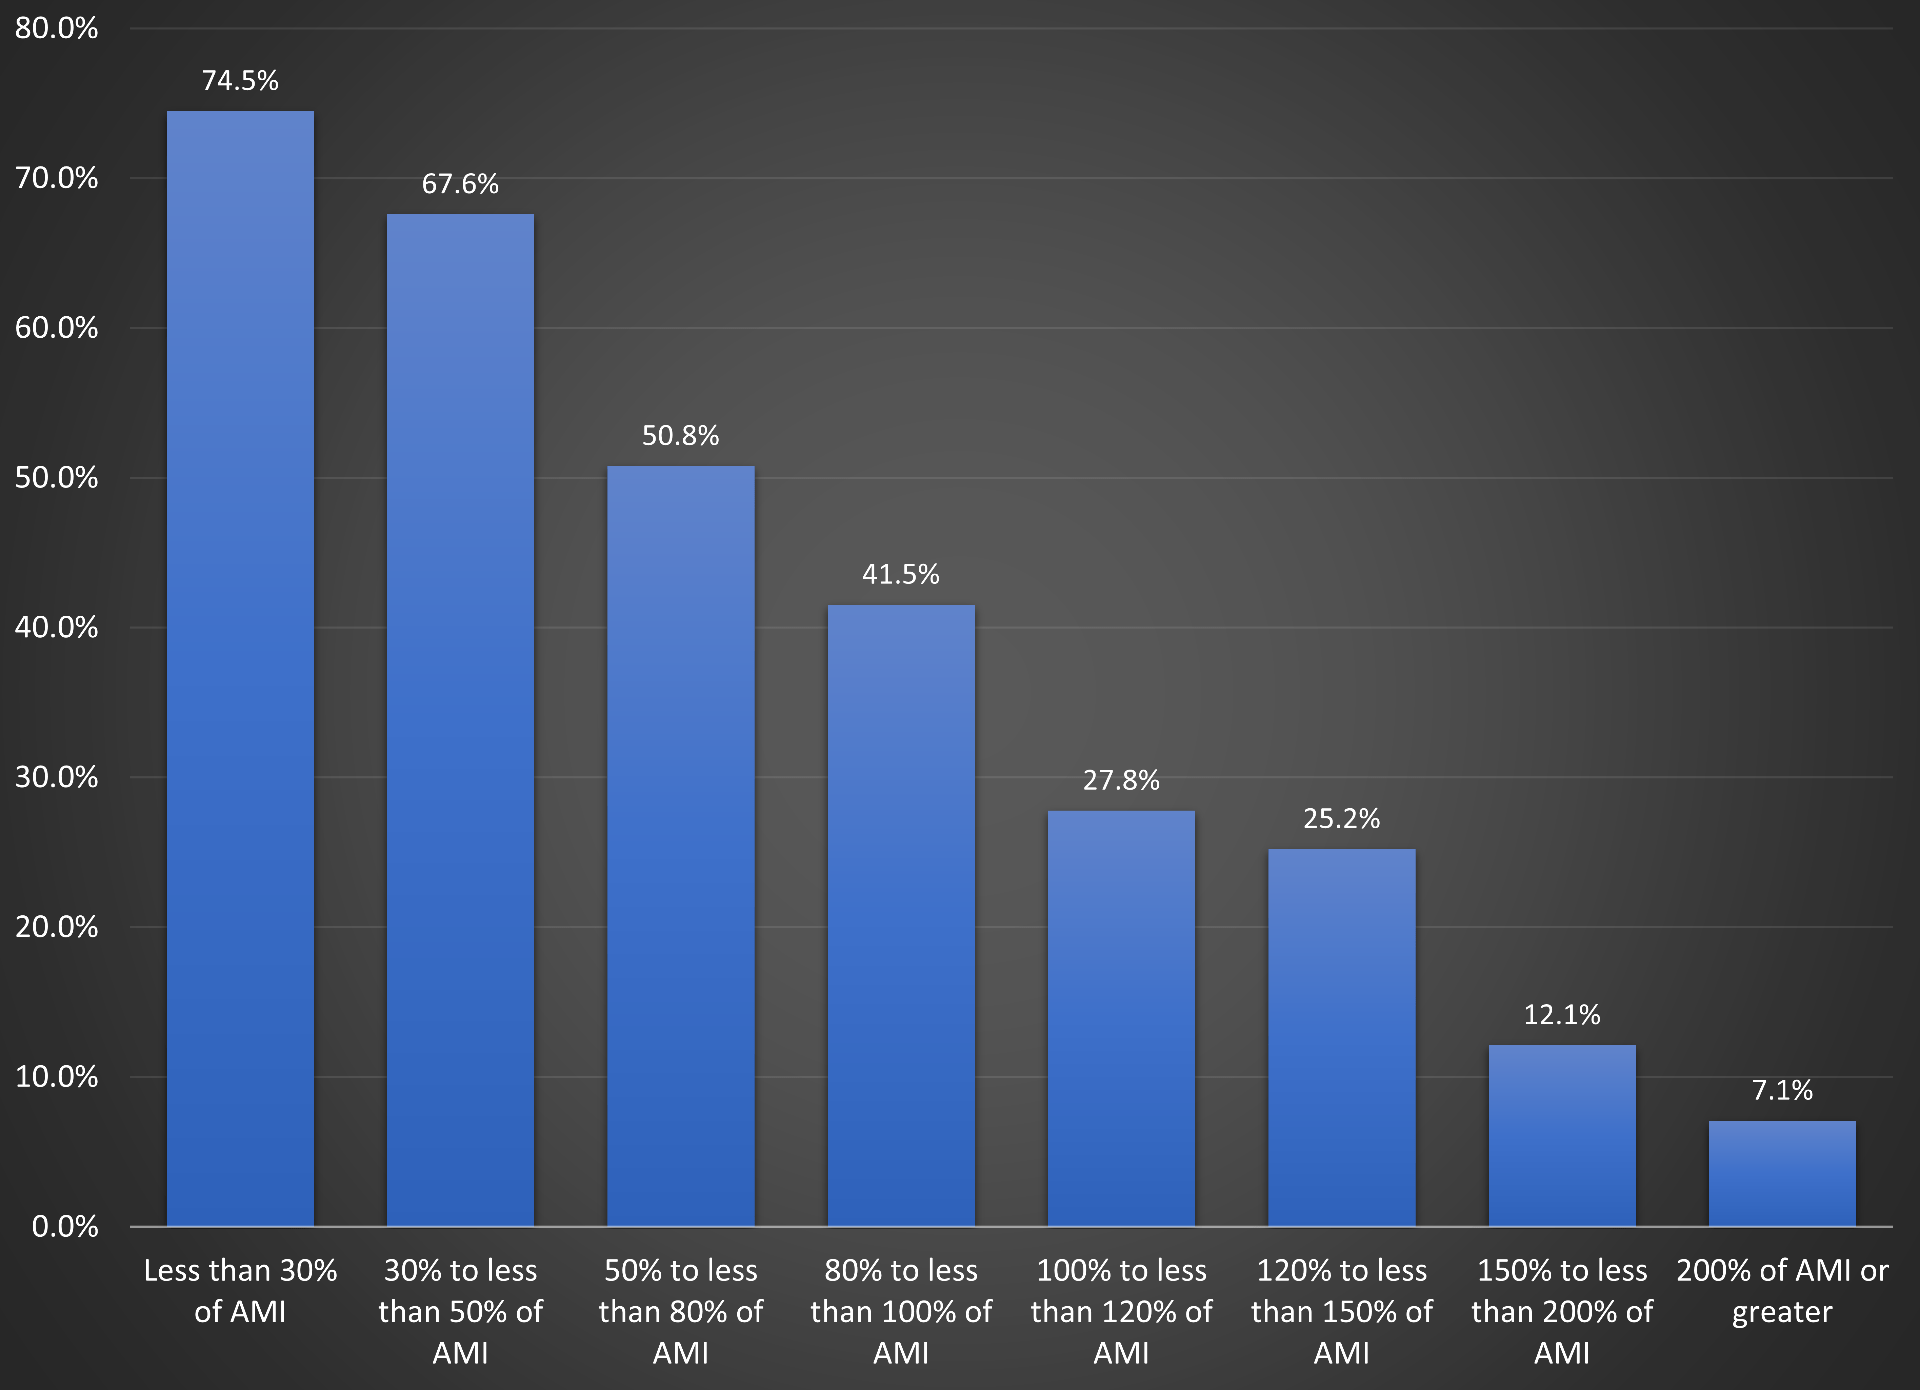
Concerning housing tenure, renter-occupied households are slightly more likely to have members in at-risk occupations compared to owner-occupied households. Namely, renter-occupied households account for roughly 30% of all wage-earning households but are 34.5% of households with at least one at-risk employee. Expressed another way, whereas around 35% of all owner-occupied households have an at-risk employee, roughly 43% of renter-occupied households contain at least one such worker. At low income levels, households with at-risk workers are much more likely to be renter-occupied than owner-occupied.
Renter share of households with at least one member employed in an at-risk occupation, by household income
Among all wage-earning households in which at least one member works in an at-risk job, renter-occupied units are significantly more likely to be housing cost-burdened compared to owner-occupied units. More precisely, roughly 44% of renter-occupied households with at least one at-risk worker spend 30% or more of their gross monthly income on housing. The corresponding figure for owner-occupied households is just 18 percent.
| Tenure for households with at least one at-risk worker | # of at-risk households | % housing cost-burdened* |
| Owner-occupied | 76,286 | 18.2% |
| Renter-occupied | 40,134 | 43.7% |
The driver of this disparity lies in the low end of the income distribution: low income renters (households with income below 50% of Rochester AMI) spend a greater share of their monthly income on housing costs relative to low income owners.
Median monthly housing cost to gross monthly income ratio for households with at least one at-risk member
To recap, the data presented so far in this post suggest that, in the Rochester metro:
- Workers of color are disproportionately prone to work in jobs that are at risk of mass layoffs or workplace closures due to COVID-19;
- At-risk workers hail disproportionately from low income households; and
- Low income renter households with at-risk employees are particularly susceptible to devastating coronavirus-related economic consequences given their high propensity to be housing cost-burdened. That is, because these households spend such high fractions of their monthly income on housing – implying that they are living “paycheck to paycheck” – temporary or permanent job loss poses an immediate threat to housing security.
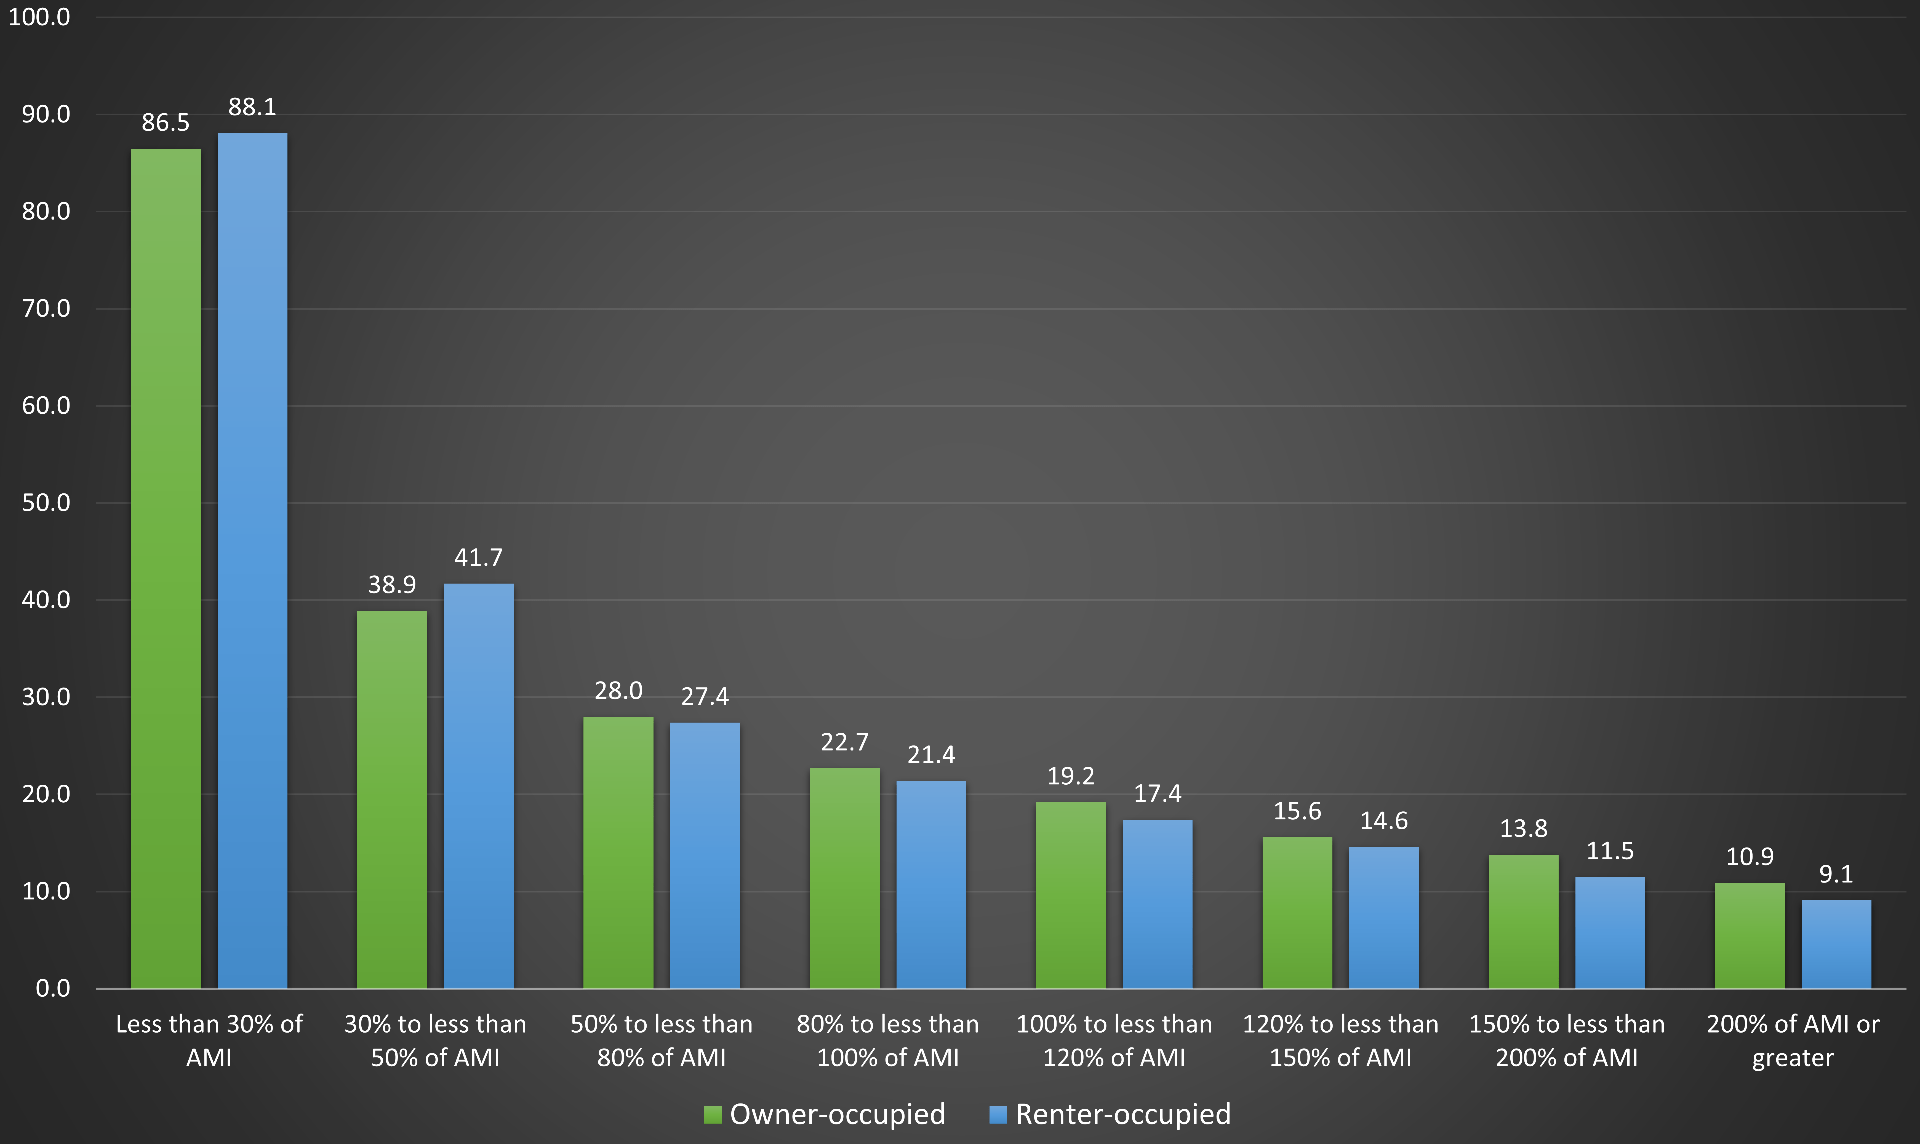
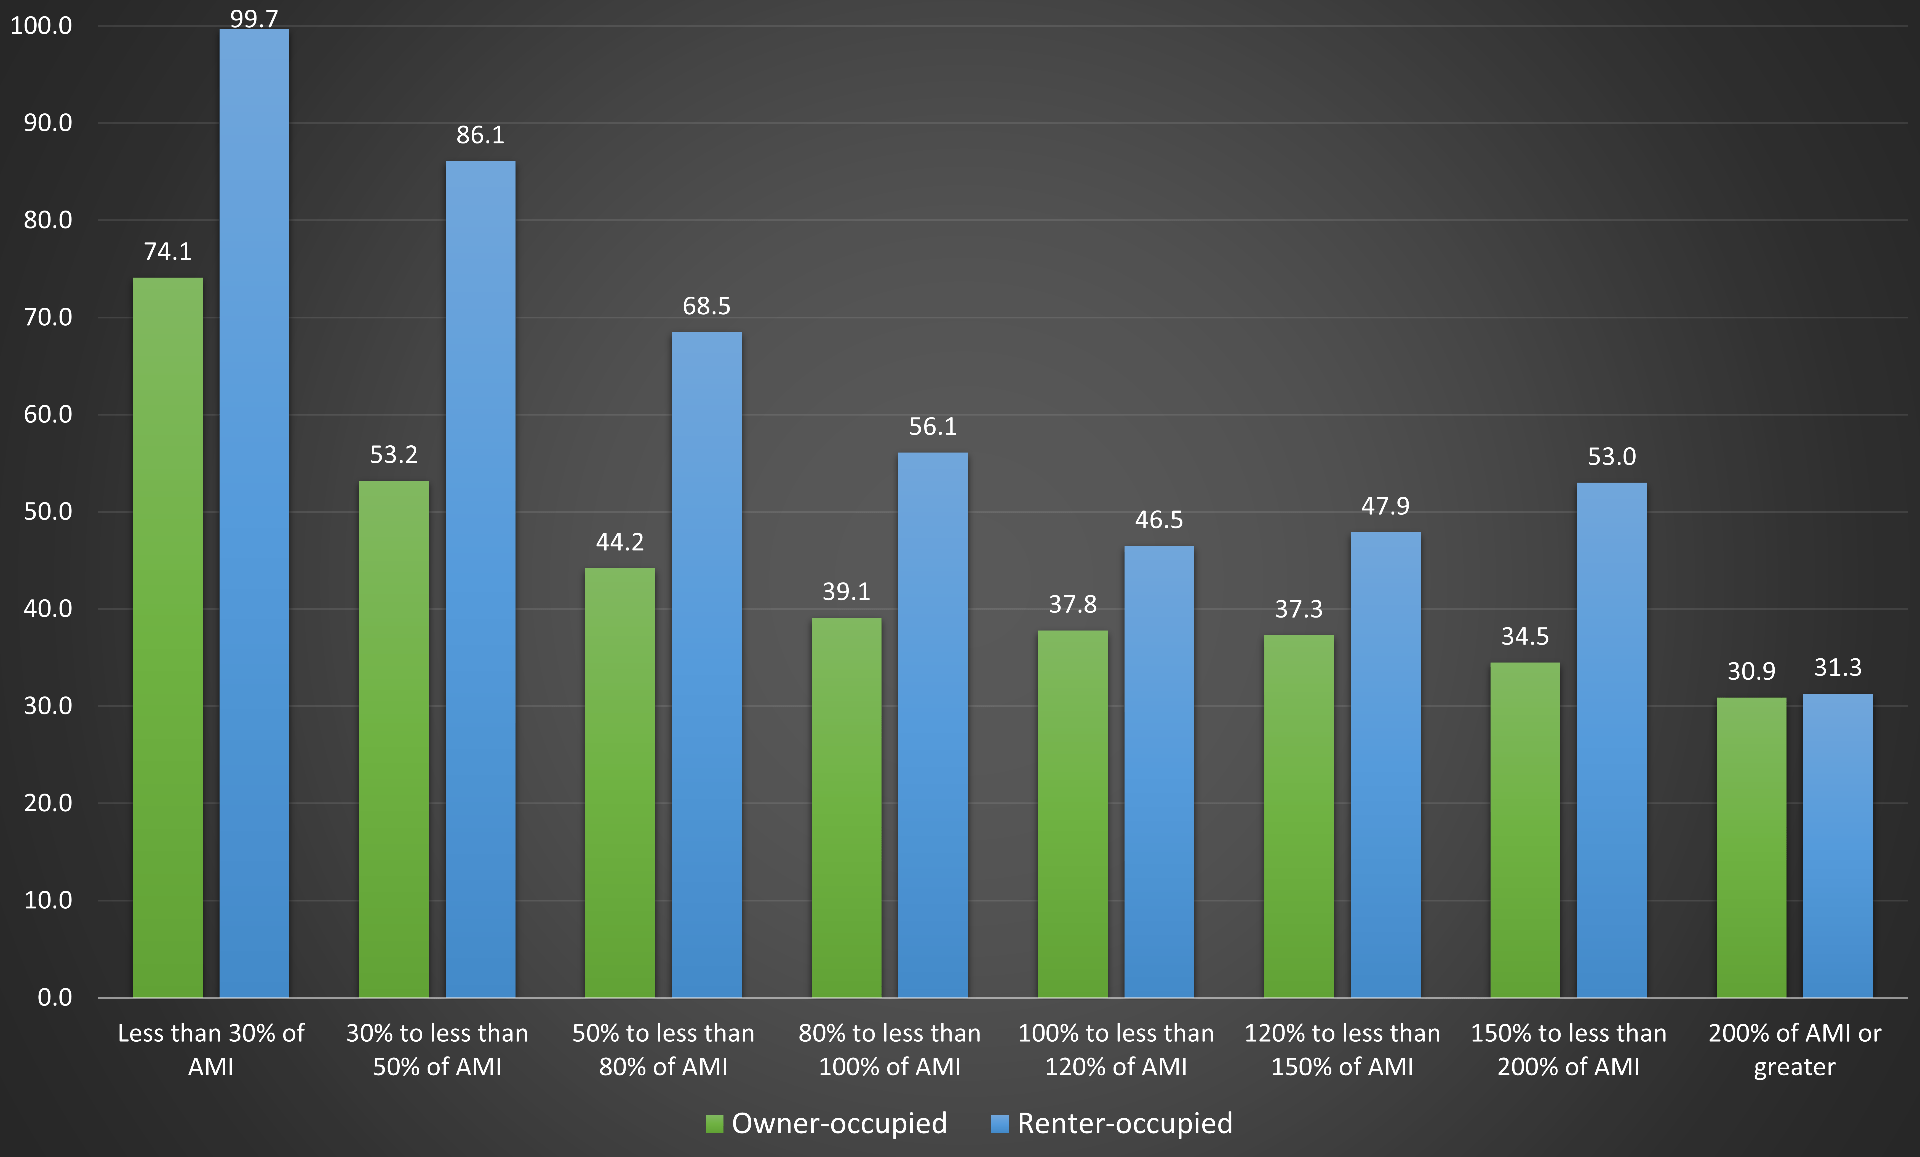
As if these trends were not already sufficiently disconcerting, the final graph presented below shows the median fraction of household income earned by members who are in at-risk jobs (broken out by housing tenure and household income). In other words, it shows the median percentage of household income that would be lost if all at-risk jobs were indeed eliminated or furloughed due to COVID-19. More than half of all income for renter households that earn below Rochester AMI comes from at-risk occupations. For the lowest income renters (households with income below 30% of AMI), essentially all household income is earned by at-risk employees.
Put another way, the most vulnerable households – the ones shown above to already be living “paycheck to paycheck” – are the ones that are most likely to lose all of their income due to COVID-19.
Median fraction of household income earned by members in at-risk occupations
In light of these trends, there is a clear urgency to invest in emergency food and shelter funds. It will also be necessary to extend existing measures that temporarily suspend utility shutoffs and halt evictions. Finally, meaningful funds must be dedicated to building the capacity of the local mutual aid networks and other direct service providers that are on the frontlines delivering resources and support to households and families in need during this time of crisis. To contribute to specific efforts in the Rochester area, please visit the following websites: