Mapping Workers At Risk of Mass Layoffs and Loss of Employer Healthcare
10 April 2020
According to new data developed by the NYU Furman Center, nearly one in every three civilian workers in New York State—about 3 million New Yorkers—work in occupations that are at risk of being swept up in mass layoffs or workplace closures due to the global COVID-19 pandemic. This post breaks those at-risk workers down by race, wage, geography, and participation in employer-provided healthcare programs to answer pressing questions about who is at risk of job loss, where workers in at-risk occupations live, and how many workers in at-risk occupations depend on employer-provided healthcare programs. We find that:
- at-risk occupations are widely distributed throughout the state, but are most prevalent in the Bronx, Queens, and Kings County portions of New York City;
- upstate counties with the highest percentages of at-risk workers (>30% of the civilian workforce) are Oswego, St. Lawrence, and Dutchess;
- workers of color and low wage workers are most likely to work in at-risk occupations;
- more than 1.6 million New Yorkers in at-risk occupations depend on employer-provided healthcare; and
- despite being the least likely employees to have employer-provided healthcare, workers of color and low wage workers have the greatest risk of losing employer health benefits due to COVID-related occupational layoffs.
At bottom, these data show how the “COVID-19 crisis is magnifying the importance of equitable public policy and exposing the structural problems that persist in our health systems and economy.”
Who is at risk of job loss?
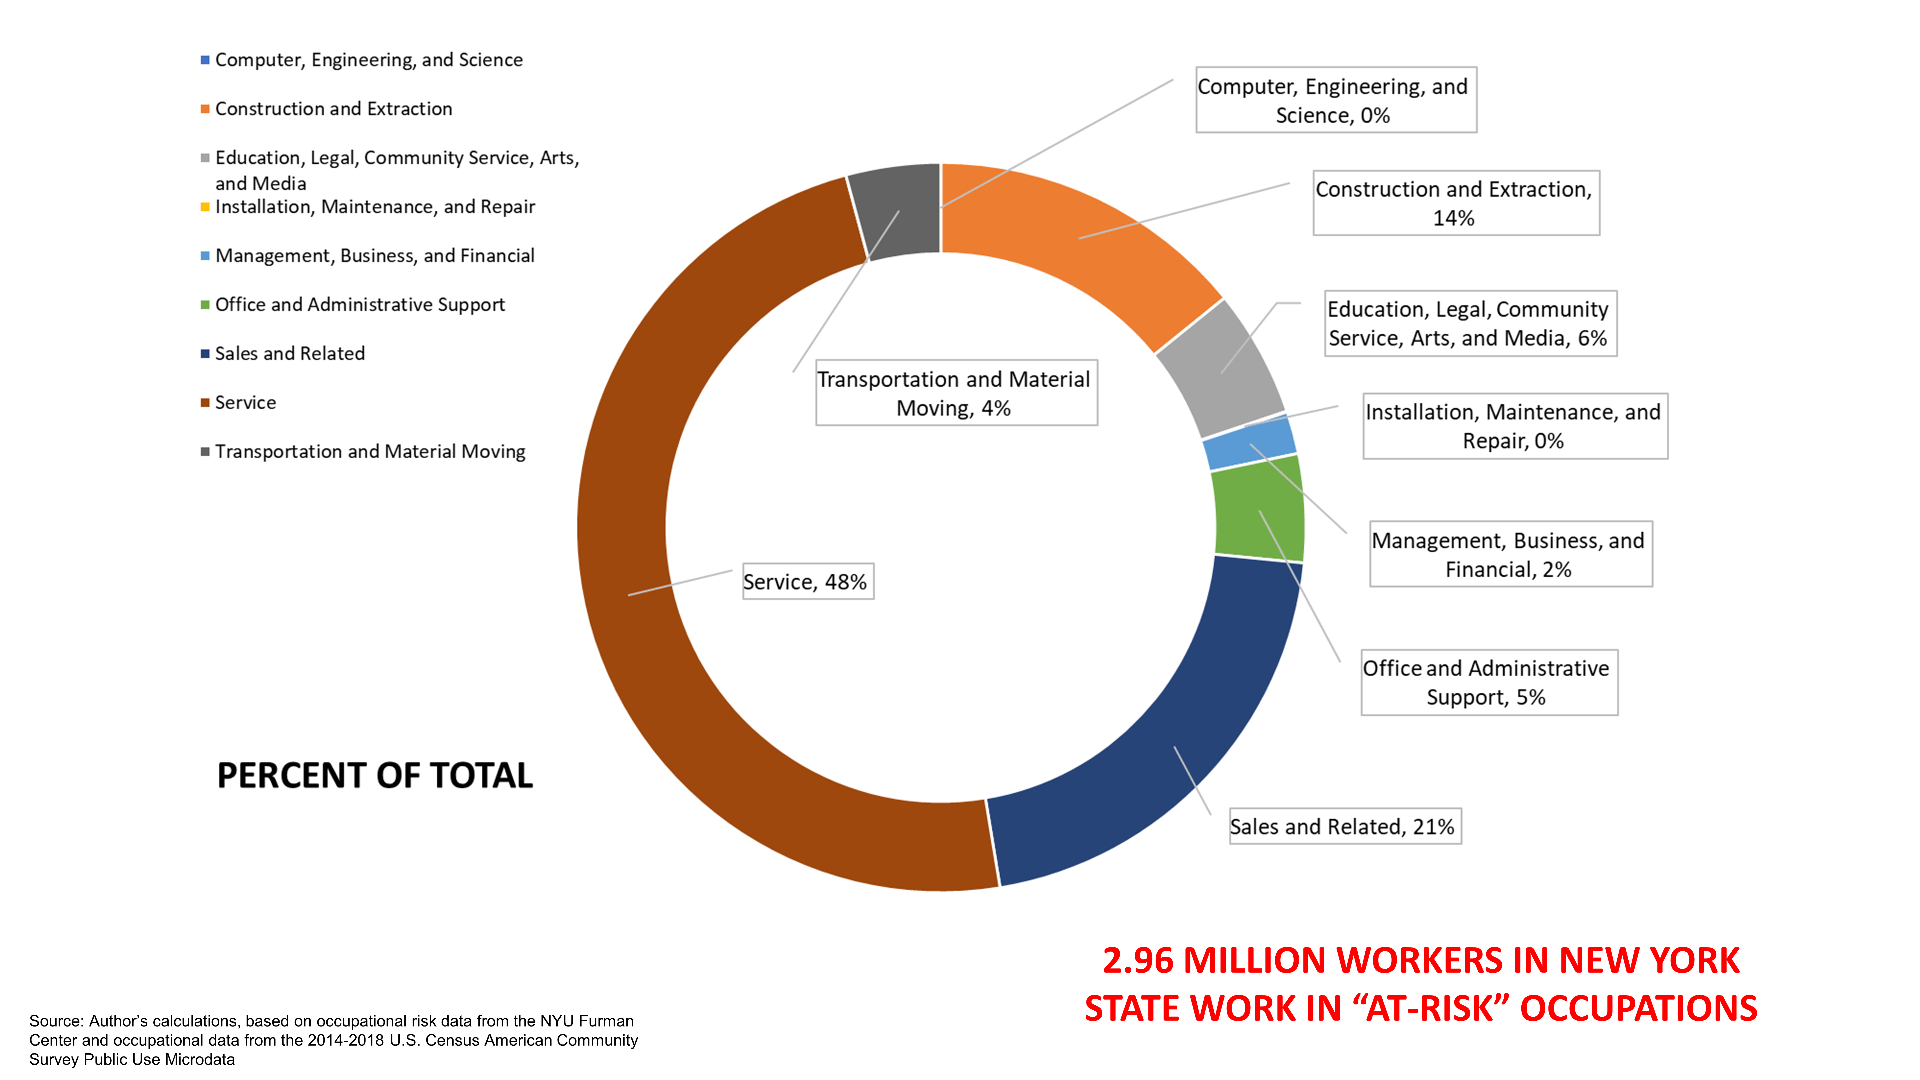
NYU Furman Center researchers analyzed 530 unique, detailed occupation titles to identify the workers who are most likely to experience job or income loss due to the COVID-19 public health crisis. Combining their expertise with insights from related projects, the Furman team singled out 109 specific occupations that have the “highest risk of mass layoffs and workplace closures due to the pandemic.” Merging those occupation codes with the most recent U.S. Census American Community Survey (ACS) Public Use Microdata Samples (PUMS) reveals that more than 2.96 million New Yorkers work in at-risk jobs. Nearly half of those workers are in the Service sector. The Sales and Construction sectors have the second and third highest totals of at-risk workers, respectively.
The most common at-risk occupations held by workers in New York State include Retail Salespersons, Janitors and Building Cleaners, Cashiers, Waiters and Waitresses, Construction Laborers, Cooks, and Childcare Workers. The table below lists the 25 most common at-risk occupations statewide, along with the estimated number of New Yorkers who hold those jobs.
Top 25 Most Common At-Risk Occupations in New York State
| Rank | At-Risk Occupation | Number of Workers |
| 1 | Retail salespersons | 215,052 |
| 2 | Janitors and building cleaners | 203,579 |
| 3 | Cashiers | 202,689 |
| 4 | Waiters and waitresses | 126,208 |
| 5 | Construction laborers | 123,230 |
| 6 | Cooks | 121,314 |
| 7 | Childcare workers | 114,978 |
| 8 | Maids and housekeeping cleaners | 109,206 |
| 9 | Office clerks, general | 101,479 |
| 10 | Personal care aides | 89,135 |
| 11 | Security guards and gaming surveillance officers | 84,172 |
| 12 | Home health aides | 76,958 |
| 13 | Sales representatives, wholesale and manufacturing | 75,261 |
| 14 | Carpenters | 69,791 |
| 15 | Food preparation workers | 62,306 |
| 16 | Taxi drivers | 60,860 |
| 17 | Hairdressers, hairstylists, and cosmetologists | 52,775 |
| 18 | Real estate brokers and sales agents | 50,632 |
| 19 | Chefs and head cooks | 47,883 |
| 20 | Electricians | 47,735 |
| 21 | Landscaping and groundskeeping workers | 46,190 |
| 22 | First-line supervisors of construction trades and extraction workers | 36,158 |
| 23 | Construction managers | 35,856 |
| 24 | Fast food and counter workers | 34,935 |
| 25 | Bus drivers, school | 33,916 |
Next, despite accounting for just 41% of New York State’s 9.43 million civilian workers, persons of color—defined as persons who identify in Census Bureau data with a racial or ethnic category other than white, not Hispanic or Latinx—account for 52% of workers in at-risk occupations. As a group, nearly two in every five workers of color (1.5 million out of 3.9 million, or 39.3%) hold at-risk occupations, compared to around one in every four white workers (1.4 million of 5.5 million, or 25.8%). Put another way, persons of color in New York State are around one-and-a-half times more likely to hold at-risk jobs than non-Hispanic white workers.
Low wage workers—defined as persons who earn below $15/hour[1]—are similarly prone to hold at-risk occupations. Such workers make up just 35% of the State’s civilian workforce but hold 55% of its at-risk jobs. Consistent with recent observations that low wage workers are especially vulnerable to COVID-related layoffs, the data suggest that around one in two low wage workers across the State could lose their jobs as the pandemic unfolds (1.6 million of 3.3 million workers, or 49.2%).
Combining the prior two observations, low wage workers of color are in line to be hit hardest by mass layoffs in New York State. Consider that persons of color are much more likely to be low wage workers (42.1%) than non-Hispanic white persons (30.1%). At the same time, as shown above, workers of color are also more likely to hold at-risk jobs. The result of these intersecting disparities is that more than 56% of low wage workers of color (924,000 of 1.64 million) are in at-risk jobs, compared to just 42% of low wage white workers (703,000 of 1.66 million).
Based on the preceding numbers, the answers to who is at risk of job or income loss due to COVID-19 are:
- Probably someone in your neighborhood or family: just under 3 million New Yorkers, or around one in every three civilian workers, are in jobs at risk of mass layoffs. Folks like store clerks, janitors, bus drivers, hair stylists, cooks, and security guards are in increasingly precarious positions as businesses remain shut down and COVID-19 continues to spread;
- Workers who are already more likely to be experiencing economic hardship: low wage workers, workers of color, and, especially, low wage workers of color are among the groups with the highest participation in at-risk jobs. Many of these workers were “barely making ends meet” before the pandemic, making the prospect of job loss all the more devastating.
Where do workers in at-risk jobs live?
The Census Bureau dataset used to study workers in at-risk jobs does not provide information on a worker’s county of residence directly. Rather, counties need to be identified indirectly, “where possible, from other…geographic [information].” According to the data provider IPUMS, an initiative of the Minnesota Population Center and leading source of Census microdata, there are only 21 counties in New York State that are identifiable in the database in this way. The remaining 41 counties are grouped together under a generic geographic code. With that in mind, it is not possible to map at-risk workers in every county in the State. However, it is possible to show that the geography of at-risk workers follows population. Put differently, the majority of at-risk jobs are downstate, with the most extreme concentrations in the Bronx (44% of civilian workers), Queens (39% of civilian workers), and Kings County (35% of civilian workers) portions of New York City (NYC). Together, these three areas account for more than 1.1 million at-risk workers, or 38% of the at-risk worker population.
In the remaining geographic areas, the percentage of the civilian workforce in at-risk jobs ranges from a low of 25% in New York County (downstate) to a high of 31% in Oswego County (upstate). Statewide, more than 31% of civilians work in at-risk occupations.

Percentage of the Workforce in At-Risk Occupations, by Geography
| Geography | Civilian Workers (000s) | % in At-Risk Jobs |
| Bronx County | 593.5 | 44.1% |
| Queens County | 1,131.1 | 38.7% |
| Kings County | 1,217.5 | 34.7% |
| New York State, Total (Statewide average) | 9,435.0 | 31.4% |
| Oswego County | 54.3 | 30.8% |
| St. Lawrence County | 44.0 | 30.8% |
| Dutchess County | 144.2 | 30.7% |
| Rest of State (remaining 41 counties, combined)* | 1,940.5 | 29.8% |
| Richmond County | 210.7 | 29.5% |
| Suffolk County | 742.9 | 29.5% |
| Orange County | 174.6 | 29.4% |
| Chautauqua County | 55.9 | 29.1% |
| Niagara County | 100.0 | 29.1% |
| Schenectady County | 72.7 | 28.8% |
| Erie County | 448.9 | 28.2% |
| Rockland County | 147.5 | 28.2% |
| Monroe County | 367.7 | 28.0% |
| Albany County | 158.5 | 26.9% |
| Nassau County | 681.6 | 26.9% |
| Rensselaer County | 81.6 | 26.6% |
| Saratoga County | 117.5 | 26.5% |
| Tompkins County | 49.5 | 25.7% |
| New York County | 900.3 | 25.2% |
Based on the information from above, answers to the question of where at-risk workers live include:
- Everywhere in New York State: the data suggest that between one-quarter and two-fifths of workers in any given County have a high risk of layoffs. Statewide, just under one in every three workers (31.4%) works in an at-risk occupation.
- In higher concentrations downstate: mirroring the geography of coronavirus cases, the distribution of at-risk jobs follows population. At-risk jobs are found in the greatest numbers and relative frequencies in NYC-area Counties, especially Bronx, Queens, and Kings Counties. These three areas account for roughly 31% of New York State’s civilian workforce, but 38% of its at-risk jobs.
How many workers in at-risk jobs depend on employer-provided healthcare programs?
The last two weeks offered a glimpse of how historic levels of unemployment claims due to the COVID-19 pandemic are already overwhelming State agencies as they work to deliver benefits to the newly jobless. While Departments of Labor were the first to feel these effects, State Health Plan Marketplaces and systems for reviewing and approving Medicaid applications are probably next in line. According to our data, around 6.6 million of 9.4 million civilian workers in New York State (70.6%) have health insurance through their employers. Nearly one-quarter (1.6 million, or 24.1%) of these workers work in at-risk occupations. Put in terms of the total Statewide civilian workforce, 17% of all New York State workers are at risk of losing their jobs and health benefits due to the pandemic. In other words, mass layoffs in at-risk occupations could strip around 170 of every 1,000 workers of income and immediate access to healthcare at the same time.
Much like the overall distribution of at-risk workers, workers in at-risk occupations with employer-provided health benefits are disproportionately persons of color and low wage employees. Concerning the former, workers of color make up 35.1% of all workers with employer health benefits, but 41.3% of workers at risk of losing those benefits through layoffs. The figures for low wage workers are even more extreme. Namely, such workers account for just 24.4% of employees with employer-provided health benefits, but 43.0% of employees with health benefits who work in at-risk occupations (around 689,000 workers). As was the case above, these two types of disparities intersect with and compound one another. The result is that low wage workers of color appear to have the highest risk of losing employer-provided health benefits due to COVID-related layoffs. Nearly one half (300,000 of 633,000, or 47.4%) of low wage workers of color with employer health benefits work in at-risk occupations, compared to just 39.2% of non-Hispanic white workers (388,000 of 991,000 workers).
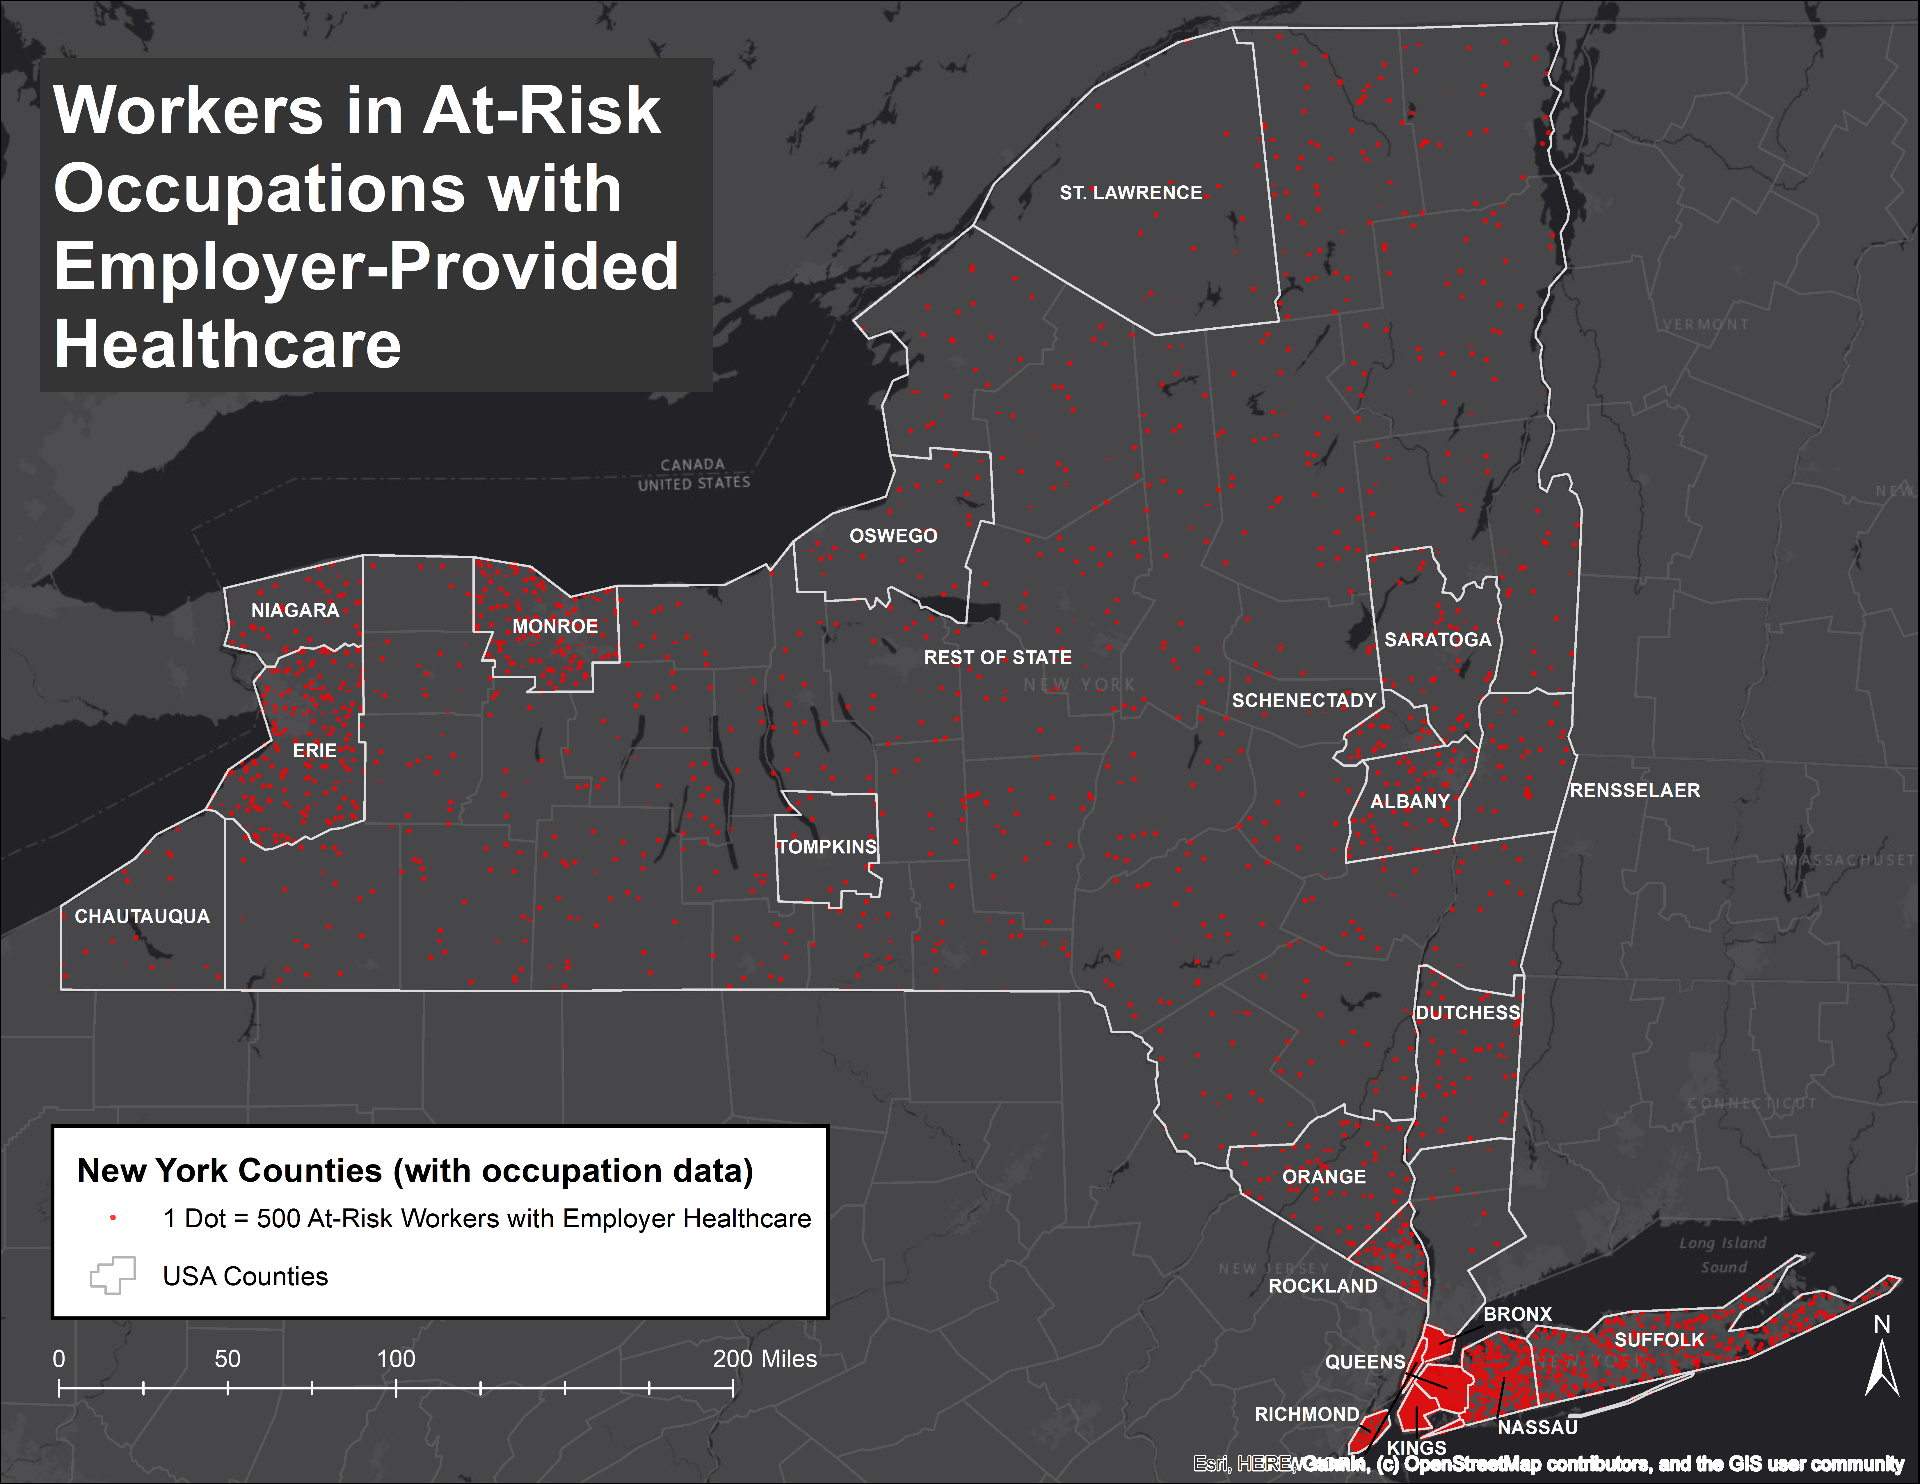
As was the case with the geographic distribution of at-risk workers in general, workers in at-risk jobs with employer health benefits are found throughout New York State. Once again, though, the distribution follows population. The highest counts of at-risk jobs with employer health benefits are found downstate, particularly in the counties that make up New York City. When adjusting the raw counts into rates per 1,000 civilian workers, however, a slightly different picture emerges. As illustrated in the table below, the highest rates of workers at risk of losing their employer-provided healthcare due to COVID-19 are found in Dutchess and Orange Counties in the Hudson Valley area. Those rates are followed by the downstate counties of Richmond and Suffolk, with Western New York’s Niagara County close behind to round out the top five.
Rate of Workers with Employer-Provided Healthcare in At-Risk Occupations, by Geography
| Geography | Civilian Workers (000s) | % with Employer-Provided Healthcare | At-Risk Jobs with Employer Healthcare (000s) | Rate of At-Risk Jobs with Employer Healthcare (per 1,000 workers) |
| Dutchess | 144.2 | 75.7% | 28.2 | 195.8 |
| Orange | 174.6 | 74.9% | 33.6 | 192.5 |
| Richmond | 210.7 | 79.2% | 40.3 | 191.2 |
| Suffolk | 742.9 | 76.9% | 141.2 | 190.0 |
| Niagara | 100.0 | 77.9% | 18.6 | 186.2 |
| Oswego | 54.3 | 72.7% | 9.8 | 180.3 |
| Saratoga | 117.5 | 80.8% | 20.7 | 176.6 |
| Erie | 448.9 | 76.9% | 79.2 | 176.4 |
| Rest of State (remaining 41 counties, combined)* | 1,940.5 | 73.5% | 341.3 | 175.9 |
| Queens | 1,131.1 | 62.3% | 198.4 | 175.4 |
| Albany | 158.5 | 80.0% | 27.6 | 174.4 |
| Schenectady | 72.7 | 74.2% | 12.6 | 173.8 |
| Monroe | 367.7 | 75.2% | 63.9 | 173.7 |
| Nassau | 681.6 | 78.0% | 118.2 | 173.4 |
| Rensselaer | 81.6 | 80.1% | 14.1 | 173.1 |
| St. Lawrence | 44.0 | 70.1% | 7.6 | 172.9 |
| Bronx | 593.5 | 53.0% | 102.1 | 172.0 |
| New York State, Total (Statewide average) | 9,435.0 | 70.6% | 1,601.4 | 169.7 |
| Chautauqua | 55.9 | 70.4% | 9.2 | 164.2 |
| Kings | 1,217.5 | 62.1% | 192.0 | 157.7 |
| Tompkins | 49.5 | 75.6% | 7.7 | 156.5 |
| Rockland | 147.5 | 68.7% | 22.5 | 152.3 |
| New York | 900.3 | 72.9% | 112.5 | 124.9 |
When expressed as a rate of the total civilian workforce, employees in occupations that face the dual risks of layoff and loss of health benefits are more likely to be found upstate. Chautauqua and Tompkins are the only two upstate Counties where the rates of such workers are less than the Statewide average (around 170 of every 1,000 workers). All remaining upstate areas exceed the Statewide average.
Along these lines, answers to the question how many workers in at-risk occupations depend on employer-provided healthcare programs include:
- Approximately 1.6 million New Yorkers, or 17% of the total civilian workforce: reflecting again on the unprecedented spike in unemployment claims that occurred at the end of March, this figure suggests that the number of applications for Medicaid and CHIP might experience a major jump in the coming days.
- More than 170 of every 1,000 workers throughout upstate, with the highest upstate concentrations in the Hudson Valley area and Western New York: although the largest counts of at-risk occupations with health benefits are downstate (following the distribution of population), only Richmond and Suffolk Counties remain in the top-five affected areas when adjusted for the size of the civilian workforce. Above-average rates are predominantly found upstate.
- More than 688,000 low wage workers, who are disproportionately persons of color: of around 1.6 million low wage workers with employer health benefits, more than 42% (688,808 workers) are in at-risk jobs. Despite accounting for just 39% of low wage workers with employer healthcare overall, persons of color account for 44% of low wage workers with employer health benefits in at-risk occupations.
Conclusion
Only time will tell how large the COVID-19 layoff wave will be and whose livelihoods will be swept away by it. In the meantime, as we begin to plan for recovery and life after the pandemic, the initial data are making two things crystal clear:
- All geographic areas of New York State are going to be impacted. Nearly one in every three jobs is currently in a heightened state of precarity. The Salespersons, Childcare Workers, School Bus Drivers, and other at-risk employees in our households and in our neighborhoods are facing new and growing threats of job loss and, in many cases, healthcare loss. All of our social networks are likely going to include persons whose lives get uprooted by COVID-19. Accordingly, solidarity must be one of the core themes of our recovery. We are all in this together.
- The most marginalized New Yorkers are likely going to feel the hardest impacts. Low wage workers and workers of color are disproportionately prone to work in at-risk jobs and at-risk jobs with employer health benefits. We cannot stand by and allow COVID-19 to exacerbate our society’s longstanding social and economic disparities. It is clearer than ever that our approach to recovery needs to be built on a foundation of equity.
—