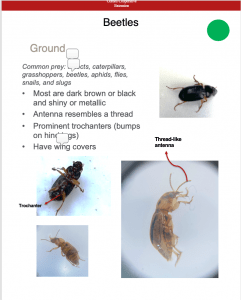
This week I did not have any farm visits, so I continued to work on my blog, poster, and insect field guide, and I also contacted the farmers to set up the August sampling dates. I also typed up the insect counting data and observations for last week at John Bowne and graphed the data in Excel. For the field guide, I put in pictures of insects I had taken while doing the countings, as well as pictures my supervisor Amara Dunn had shared with me. Here is an example page of the guide:
I added arrows and labels to point out specific parts of insects that I use to help identify them. On the poster, I edited the background section to make it more concise and also added more graphs of the previous weeks’ July insect counting. My supervisor and I decided that to make the poster easier to read, it would be better to include all data from all locations into a single graph for each month, so there would only be three graphs in total on the poster, rather than five, and the scale would make it easier to compare the data from the different locations.

