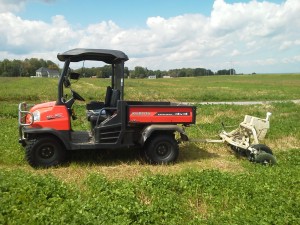
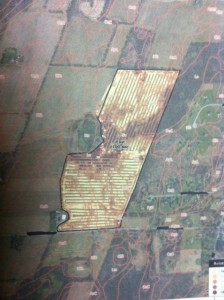
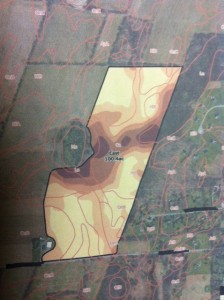
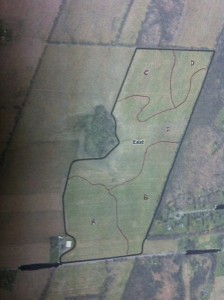
During the last week of my internship I had the opportunity to learn about electr0conductivity mapping. In field data is collected with the use of Veris Technologies’ EC machine, which can be pulled behind a truck or a smaller machine such as a Kubota RTV. Collecting data with the EC machine allows a farm to map soil type variation within field very accurately. The EC machine allows a technician to make passes in the field every sixty feet, while data and GPS location is collected every second by the Veris Surveyor and YUMA (GPS unit). The raw data is then sent to the GIS group that analysis the data and then makes a map with five different EC values from low (lightest color) to high (darkest color). After that the maps are then sent back to the service manager that works with the farm to make the final say in how the field is broke up into subsections. A work order is then made to have a field technician soil sample within these subsections so there is a more accurate understanding of the variation within the field. Also with these new maps their is the potential for the grower to begin variable rate application of certain inputs such as fertilizer.


Speak Your Mind