Tag Archives: reports

NEWA annual reports are available to the public

NEWA publishes a yearly report for stakeholders. These summaries document NEWA IPM extension to New York State growers along with other users served by NEWA partners. NEWA is a program of the New York State IPM Program which is part of Cornell Cooperative Extension.

A complete listing of annual reports is available here:

Click here for a list of NEWA annual reports

Each NEWA report includes an annual summary of the following:

  • operation and maintenance
  • geographic expansion
  • web use statistics
  • outreach
  • existing model upgrades
  • new model development
  • grants, projects, and initiatives
  • publications

Twenty-one NEWA annual reports are available for download, beginning in 1996 when NEWA was established by NYSIPM. Reports are published in January of each year.

Join our email list to be notified when the 2018 report is released.

Stay informed about NEWA. Click here to get regular updates.
New features added to daily and hourly summaries

Hourly and daily data summaries are a popular feature of NEWA. Several updates have been made to improve user experience and deliver enhanced data sets.

Soil data

Certain Rainwise stations collect soil temperature data, soil tension (moisture), or both. NEWA locations linked to instrument panels with these optional sensor add-ons now report calculated hourly and daily values in weather station summary pages. Temperature values are reported in degrees Fahrenheit.  Soil tension is reported in centibars or kilopascals (what is this?).

Calculated soil temperature and tension values are an average of all reported data points within a given period of time. For example, a station set to a 1-minute data collection interval gathers 60 soil temperature readings in 1 hour. The calculated value reported for that time period will be an average of the 60 soil temperature readings.

User interface

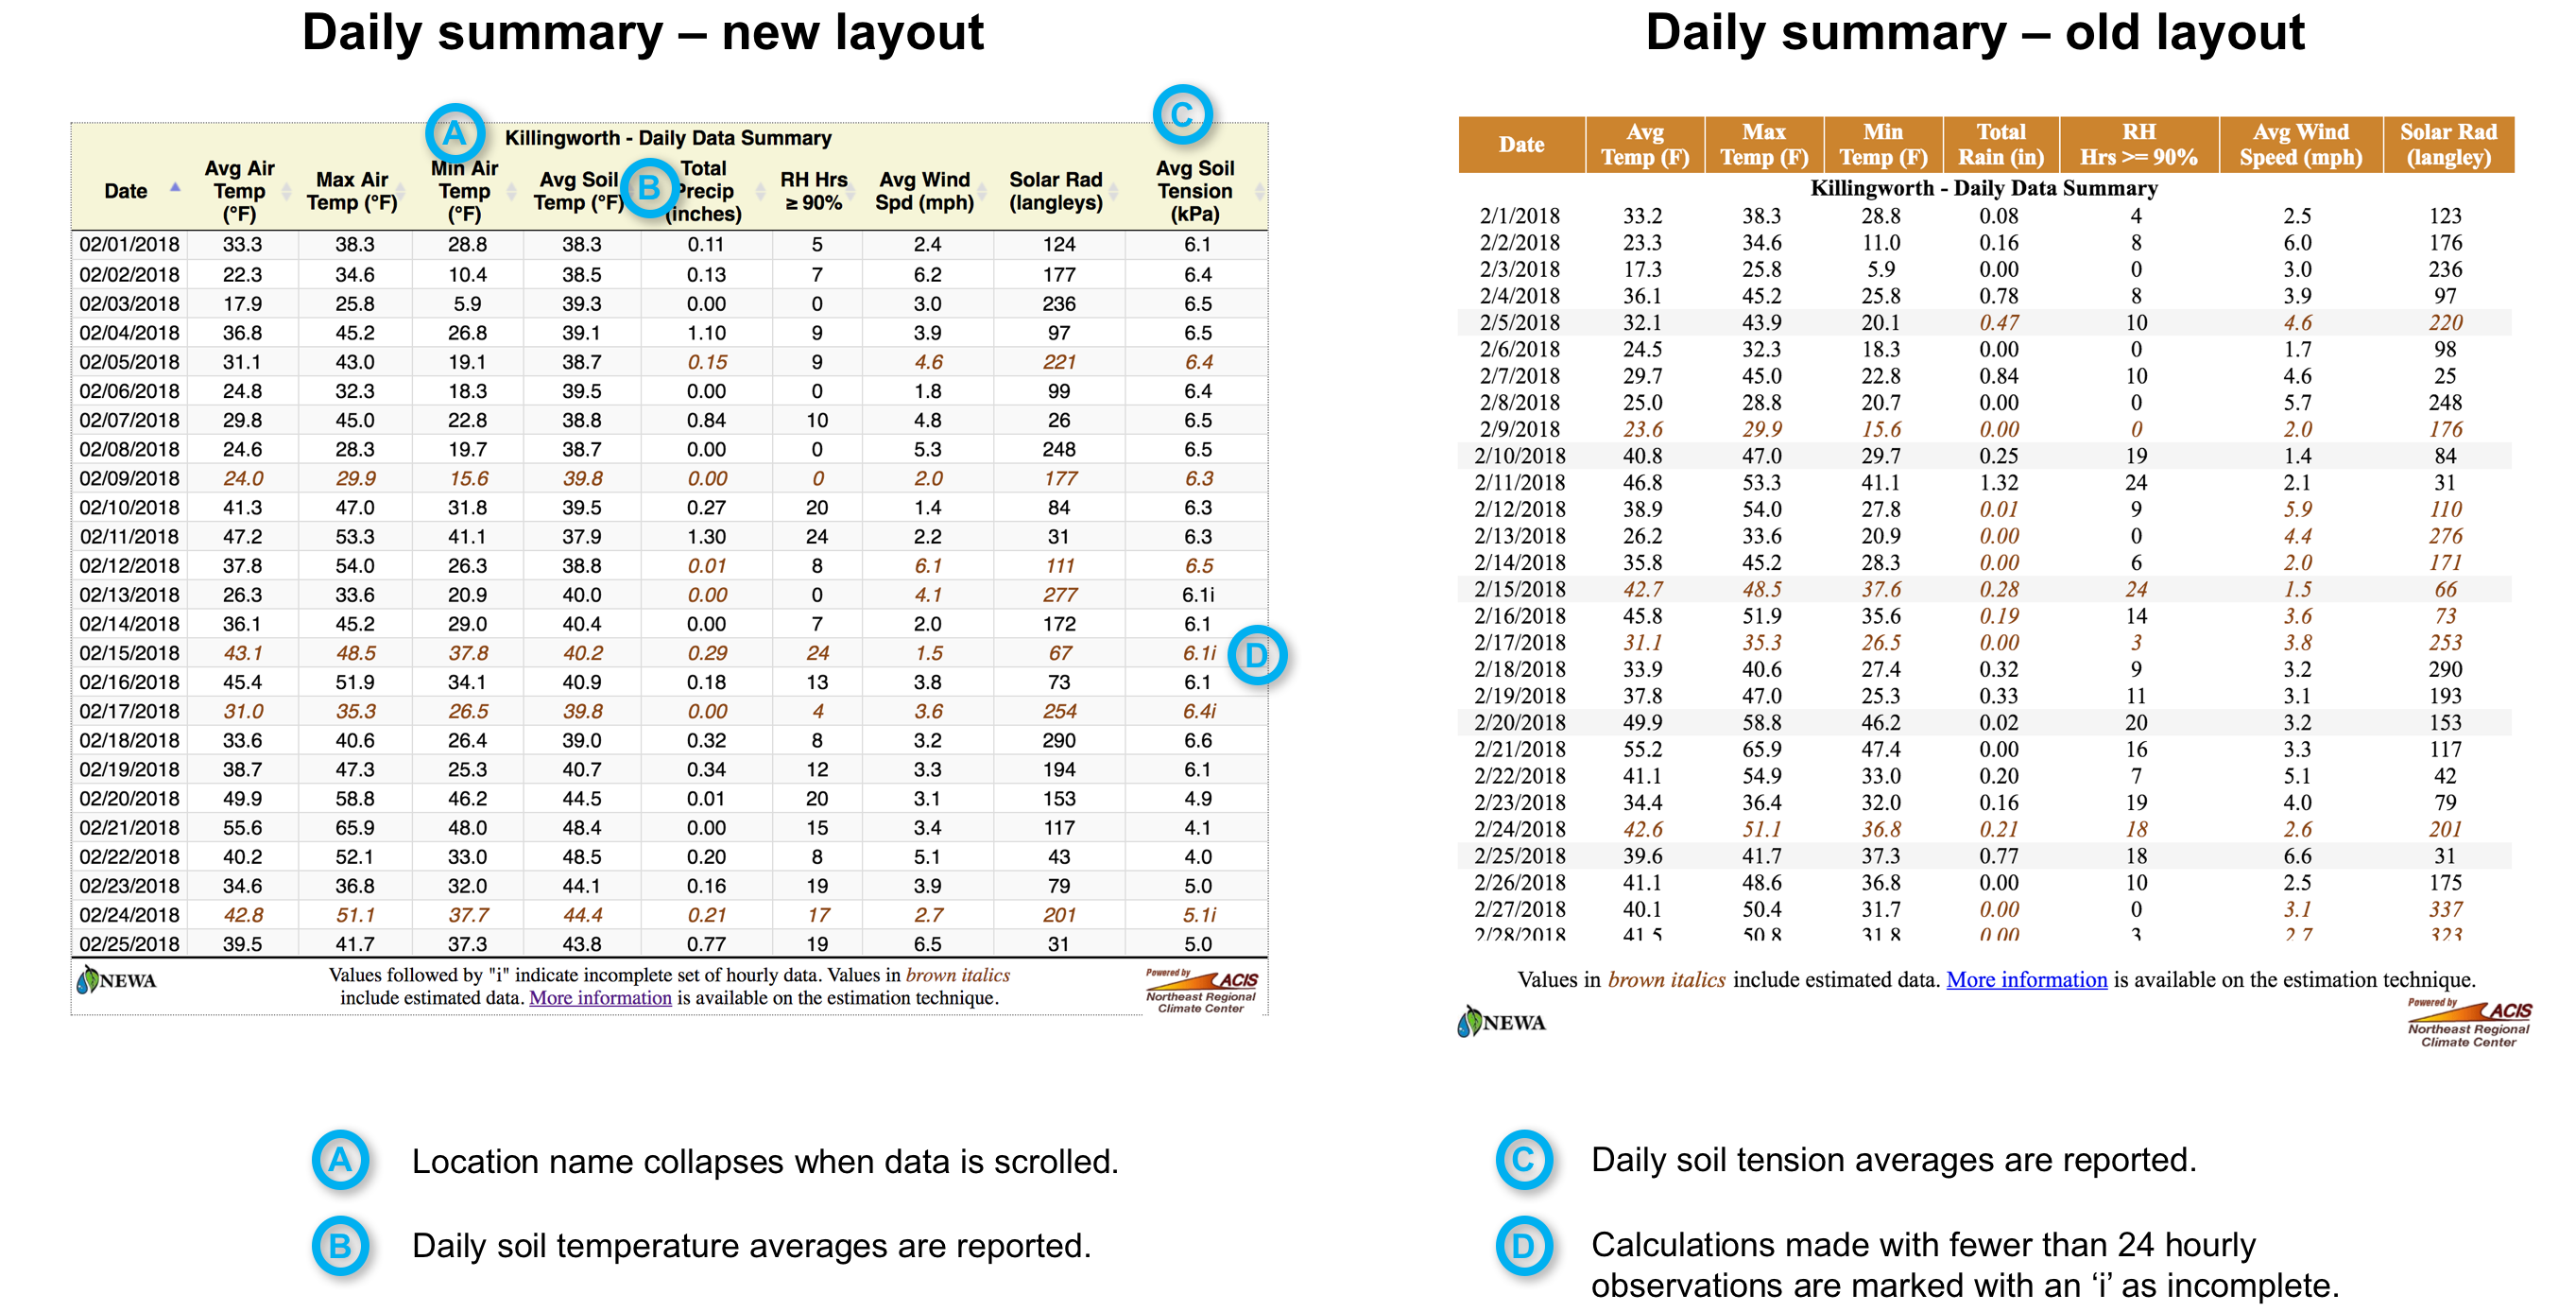
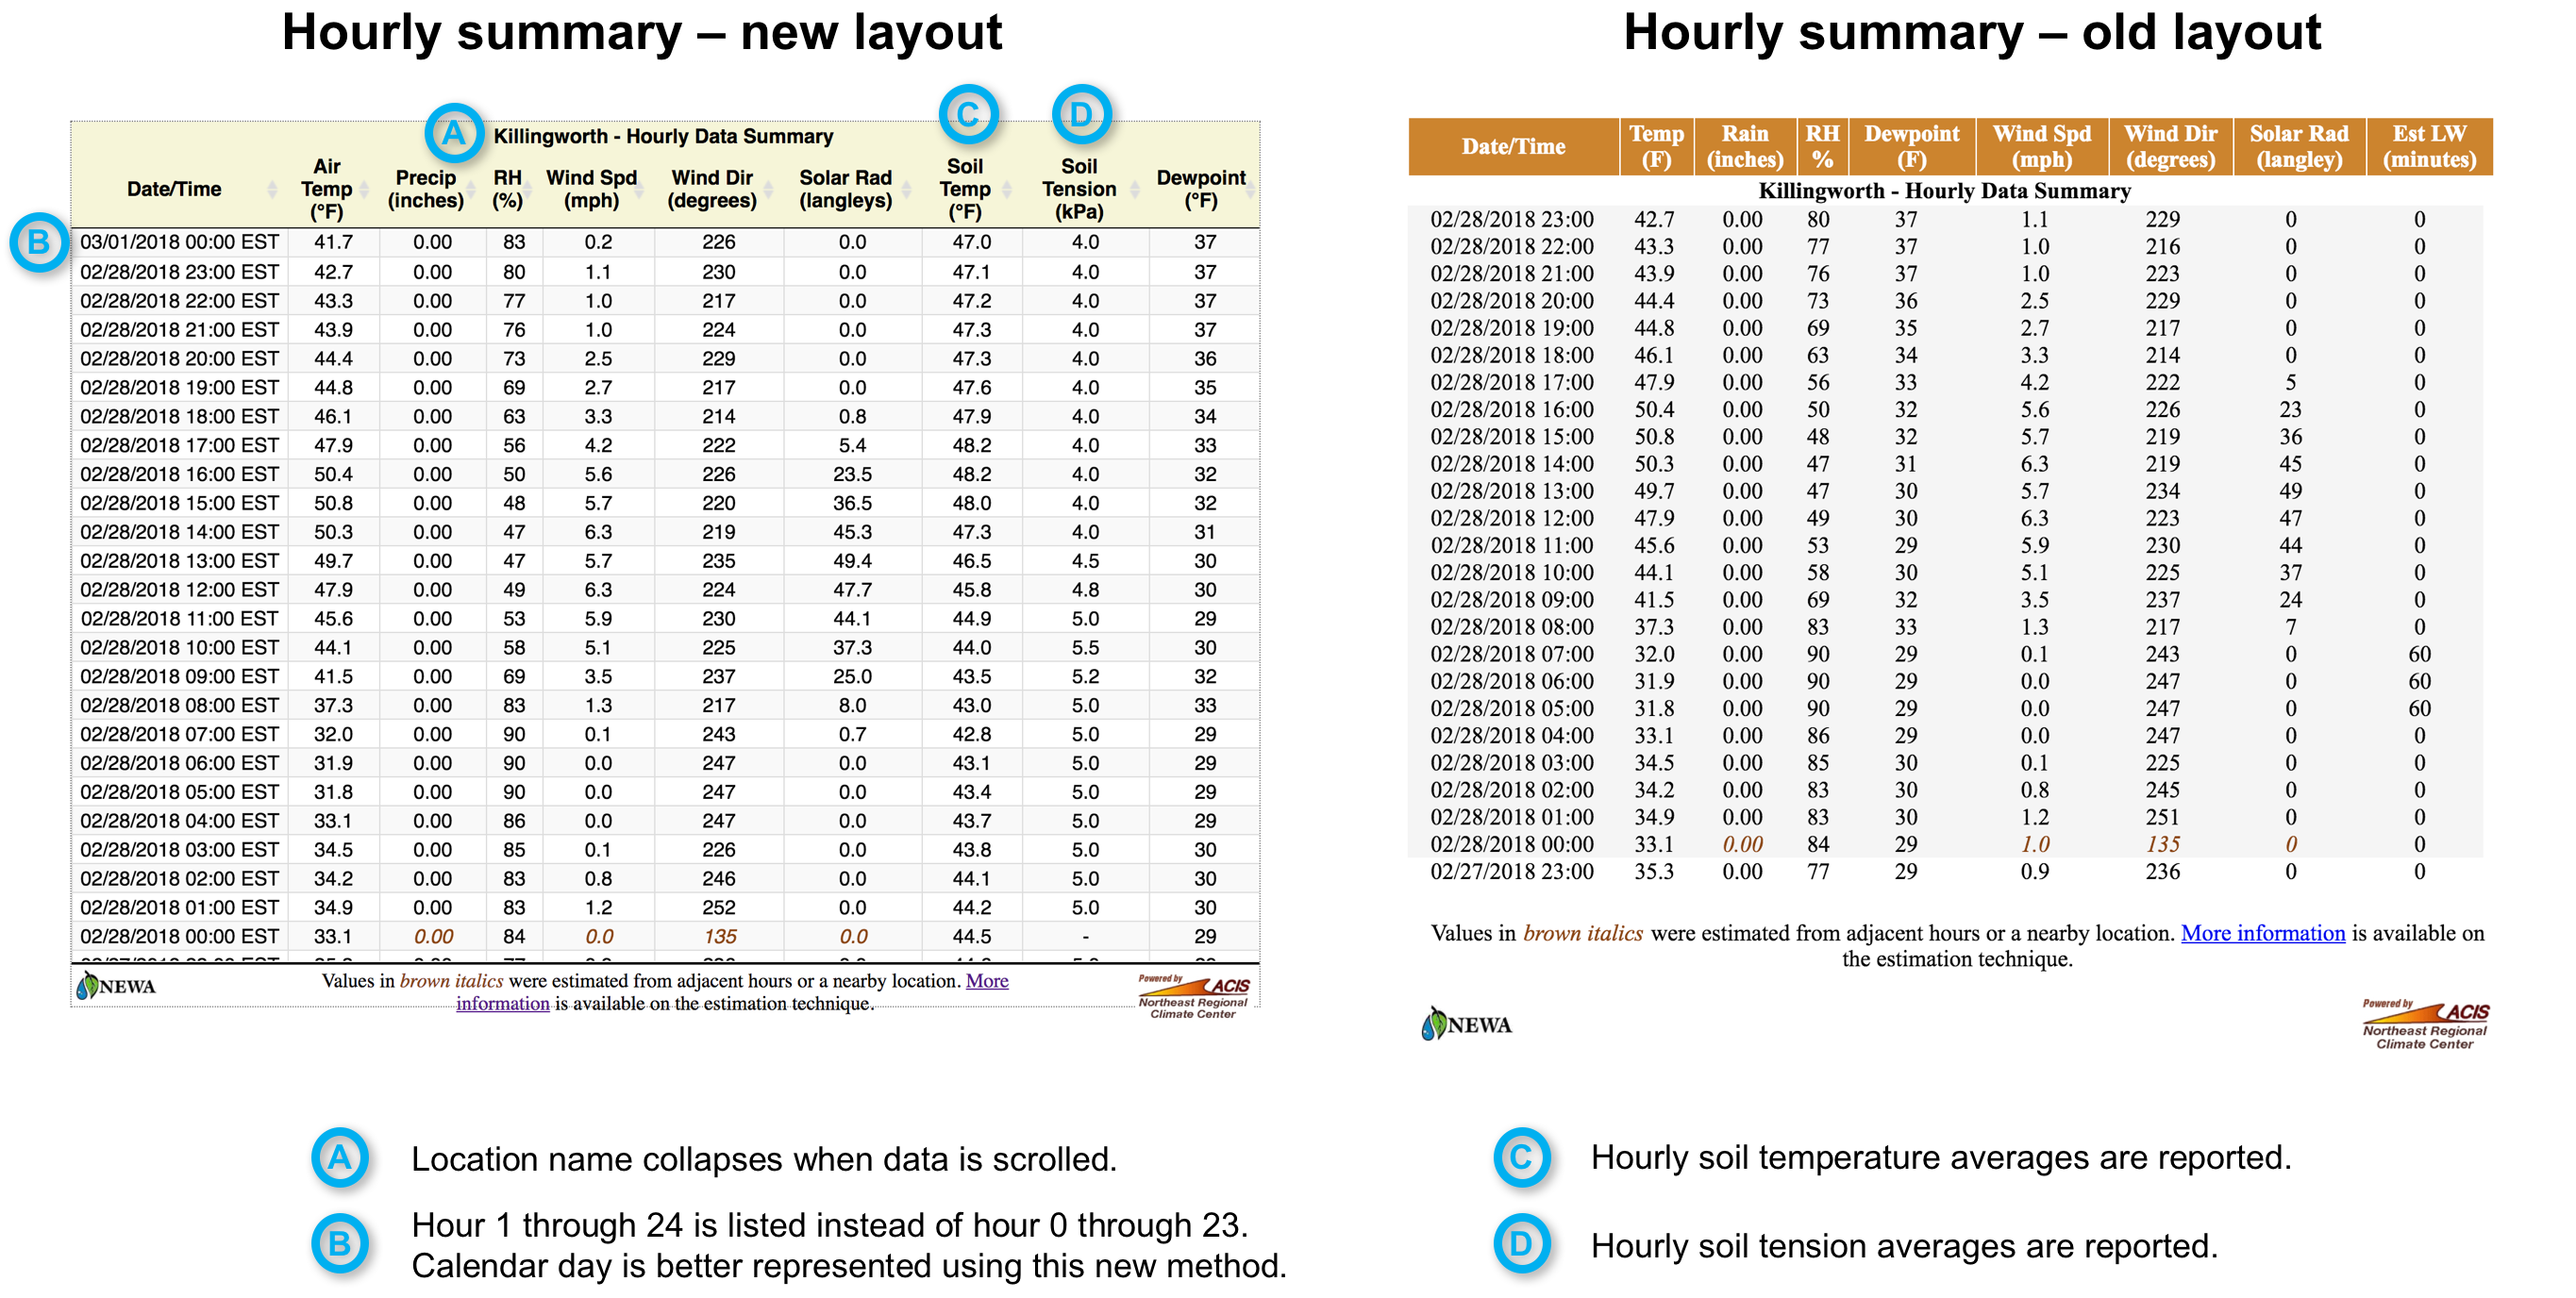
Data presented in hourly and daily weather summaries are now presented through an improved user interface (Figure 1, Figure 2). Key features include:

  • Soil temperature and tension reporting (when applicable).
  • Collapsing location name.
  • Sort by column functionality.

Figure 1. New features in hourly weather summaries.

Figure 2. New features in daily weather summaries.

Data quality control

Calculated daily values made using fewer than 24 hourly observations are now marked with an “i” to notify users of an incomplete data set (Figure 2).

Farm adaptation: grower programs and resources

A variety of programs and informational resources are available to inform your farm adaptation plan.  NEWA provides real time forecasting tools for insect and disease pests. The Cornell Smart Farming Program provides tools for growers to address longer term climate concerns. The Animal Agriculture in a Changing Climate project provides a specialized set of tools for livestock producers. A number of reports have also been published recently that have information useful to the agricultural community.

Program Description
Network for Environment and Weather Applications (New York State Integrated Pest Management Program) NEWA delivers weather information and apps based on the weather collected that support and advance integrated pest management (IPM) and best management practices for agricultural and green industries. Our vision is that NEWA will become the source for weather-related information for the IPM practitioner in the Northeast
Cornell Smart Farming Program (Cornell Institute for Climate Smart Solutions) The Cornell Climate Smart Farming program is a voluntary initiative that helps farmers in New York and the northeastern US to increase productivity in a sustainable way, reduce greenhouse gas emissions from agricultural production, and increase farm resiliency to extreme weather and climate variability.
Animal Agriculture in a Changing Climate (Cornell University Dairy Environmental Systems Program) Animal Agriculture in a Changing Climate fosters animal production practices that are environmentally sound and economically viable, and that create resiliency for animal producers and their partners.
United States Department of Agriculture Northeast Climate Hub The Northeast Climate Hub, building on capacity within USDA, delivers science-based knowledge and practical information to farmers, ranchers and forest landowners in Maine, New Hampshire, Vermont, Massachusetts, Rhode Island, Connecticut, New York, New Jersey, Pennsylvania, Maryland, Delaware, West Virginia and D.C
CLN eLearning  (Southern Regional Extension Forestry) CLN eLearning is designed to help Extension Professionals, Professional Crop Advisors and Professional Foresters incorporate climate change into their existing program areas and become Climate Literate. Many of our modules offer Continuing Education Credits from SAF and CCA.
Report  Description
 2014 USDA Climate Change Adaptation Plan  (USDA Office of the Chief Economist)

The U.S. Department of Agriculture (USDA) Climate Change Adaptation Plan presents strategies and actions to address the effects of climate change on key mission areas including agricultural production, food security, rural development, and forestry and natural resources conservation.

The 2014 USDA Climate Change Adaptation Plan includes input from eleven USDA agencies and offices.  It provides a detailed vulnerability assessment, reviews the elements of USDA’s mission that are at risk from climate change, and provides specific actions and steps being taken to build resilience to climate change.

National Climate Assessment: Agriculture (U.S. Global Change Research Program) The full report of the National Climate Assessment provides an in-depth look at climate change impacts on the U.S. and explores the impacts to agriculture.
Climate Impacts on Agriculture and Food  (United States Environmental Protection Agency) Agriculture is an important sector of the U.S. economy. The crops, livestock, and seafood produced  in the United States contribute more than $300 billion to the economy each year. When food-service and other agriculture-related industries are included, the agricultural and food sectors contribute more than $750 billion to the gross domestic product

Read part 1 and part 2 of this series.