Bill Cox, Eric Sandsted, and Phil Atkins
We initiated a 4-year study at the Aurora Research Farm in 2015 to compare the corn, soybean, and wheat/red clover rotation with different crop sequences in conventional and organic cropping systems during the 36-month transition and early certification period to an organic cropping system. One of the many objectives of the study was to determine if corn, soybean, and wheat respond similarly to management inputs (high and recommended) in conventional and organic cropping systems. This article will discuss the agronomic performance of organic wheat and conventional wheat with recommended and high inputs in the 4th year of the study (red clover-corn-soybean-wheat/red clover).
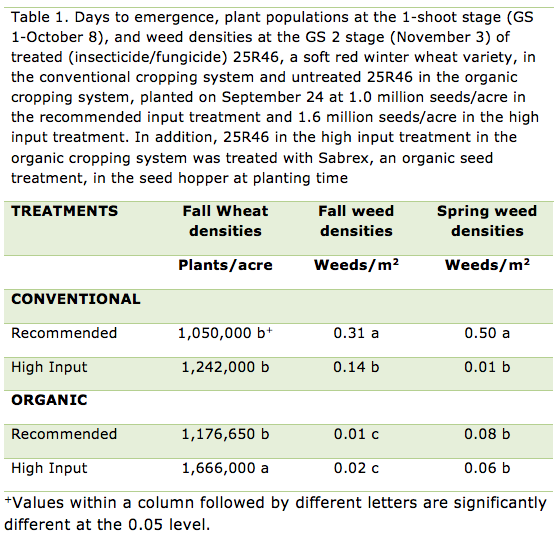
We no-tilled a treated (insecticide/fungicide seed treatment) Pioneer soft red wheat variety, 25R46, in the conventional cropping system; and the untreated 25R46 in the organic cropping system at two seeding rates, ~1.2 million seeds/acre (recommended input) and ~1.7 million seeds/acre (high input treatment) with a John Deere 1590 No-Till Grain Drill (7.5 inch spacing between drills) on September 27, the day after soybean harvest. We applied about 200 lbs. /acre of 10-20-20 as a starter fertilizer to wheat in both conventional treatments. We also applied Harmony Extra (~0.75 oz. /acre) to the high input conventional treatment at early tillering or GS 2 stage in the fall (October 27) for control of winter perennials (dandelion in particular).

We applied the maximum amount of Kreher’s composted chicken manure (5-4-3 analysis) that would flow through the drill as a starter fertilizer (~150 lbs. of material/acre) in both organic treatments. We also broadcast Kreher’s composted manure the day after planting to provide ~50 lbs. of actual N /acre (assuming 50% available N from the composted manure) in the high input treatment of the organic cropping system. In addition, we also added Sabrex, an organic seed treatment with Tricoderma strains, to the seed hopper of 25R46 in the high input treatment in the organic cropping system.
We frost-seeded red clover into all the wheat treatments on March 22. We applied ~70 lbs. of actual N/acre (33-0-0, ammonium nitrate) in the recommended input treatment of conventional wheat on March 23, about a week before green-up. In the high input conventional treatment, we applied ~50 lbs. of actual N/acre (33-0-0) on March 23 and then applied another 50 lbs. of actual N/acre on April 26 about 10 days before the jointing stage (GS 6). We also applied a fungicide (Prosaro at 4 oz. /acre) to the high input treatment on May 30.
We applied Kreher’s composted chicken manure to provide ~70 lbs. of available N/acre to organic wheat in the recommended input treatment on March 21. Also, we applied an additional ~50 lbs. of available N/acre to organic wheat in the high input treatment on March 21. All the plots were harvested with an Almaco plot combine on July 10. We collected a 1000 gram from each plot to determine kernel moisture and grain N% in the laboratory.
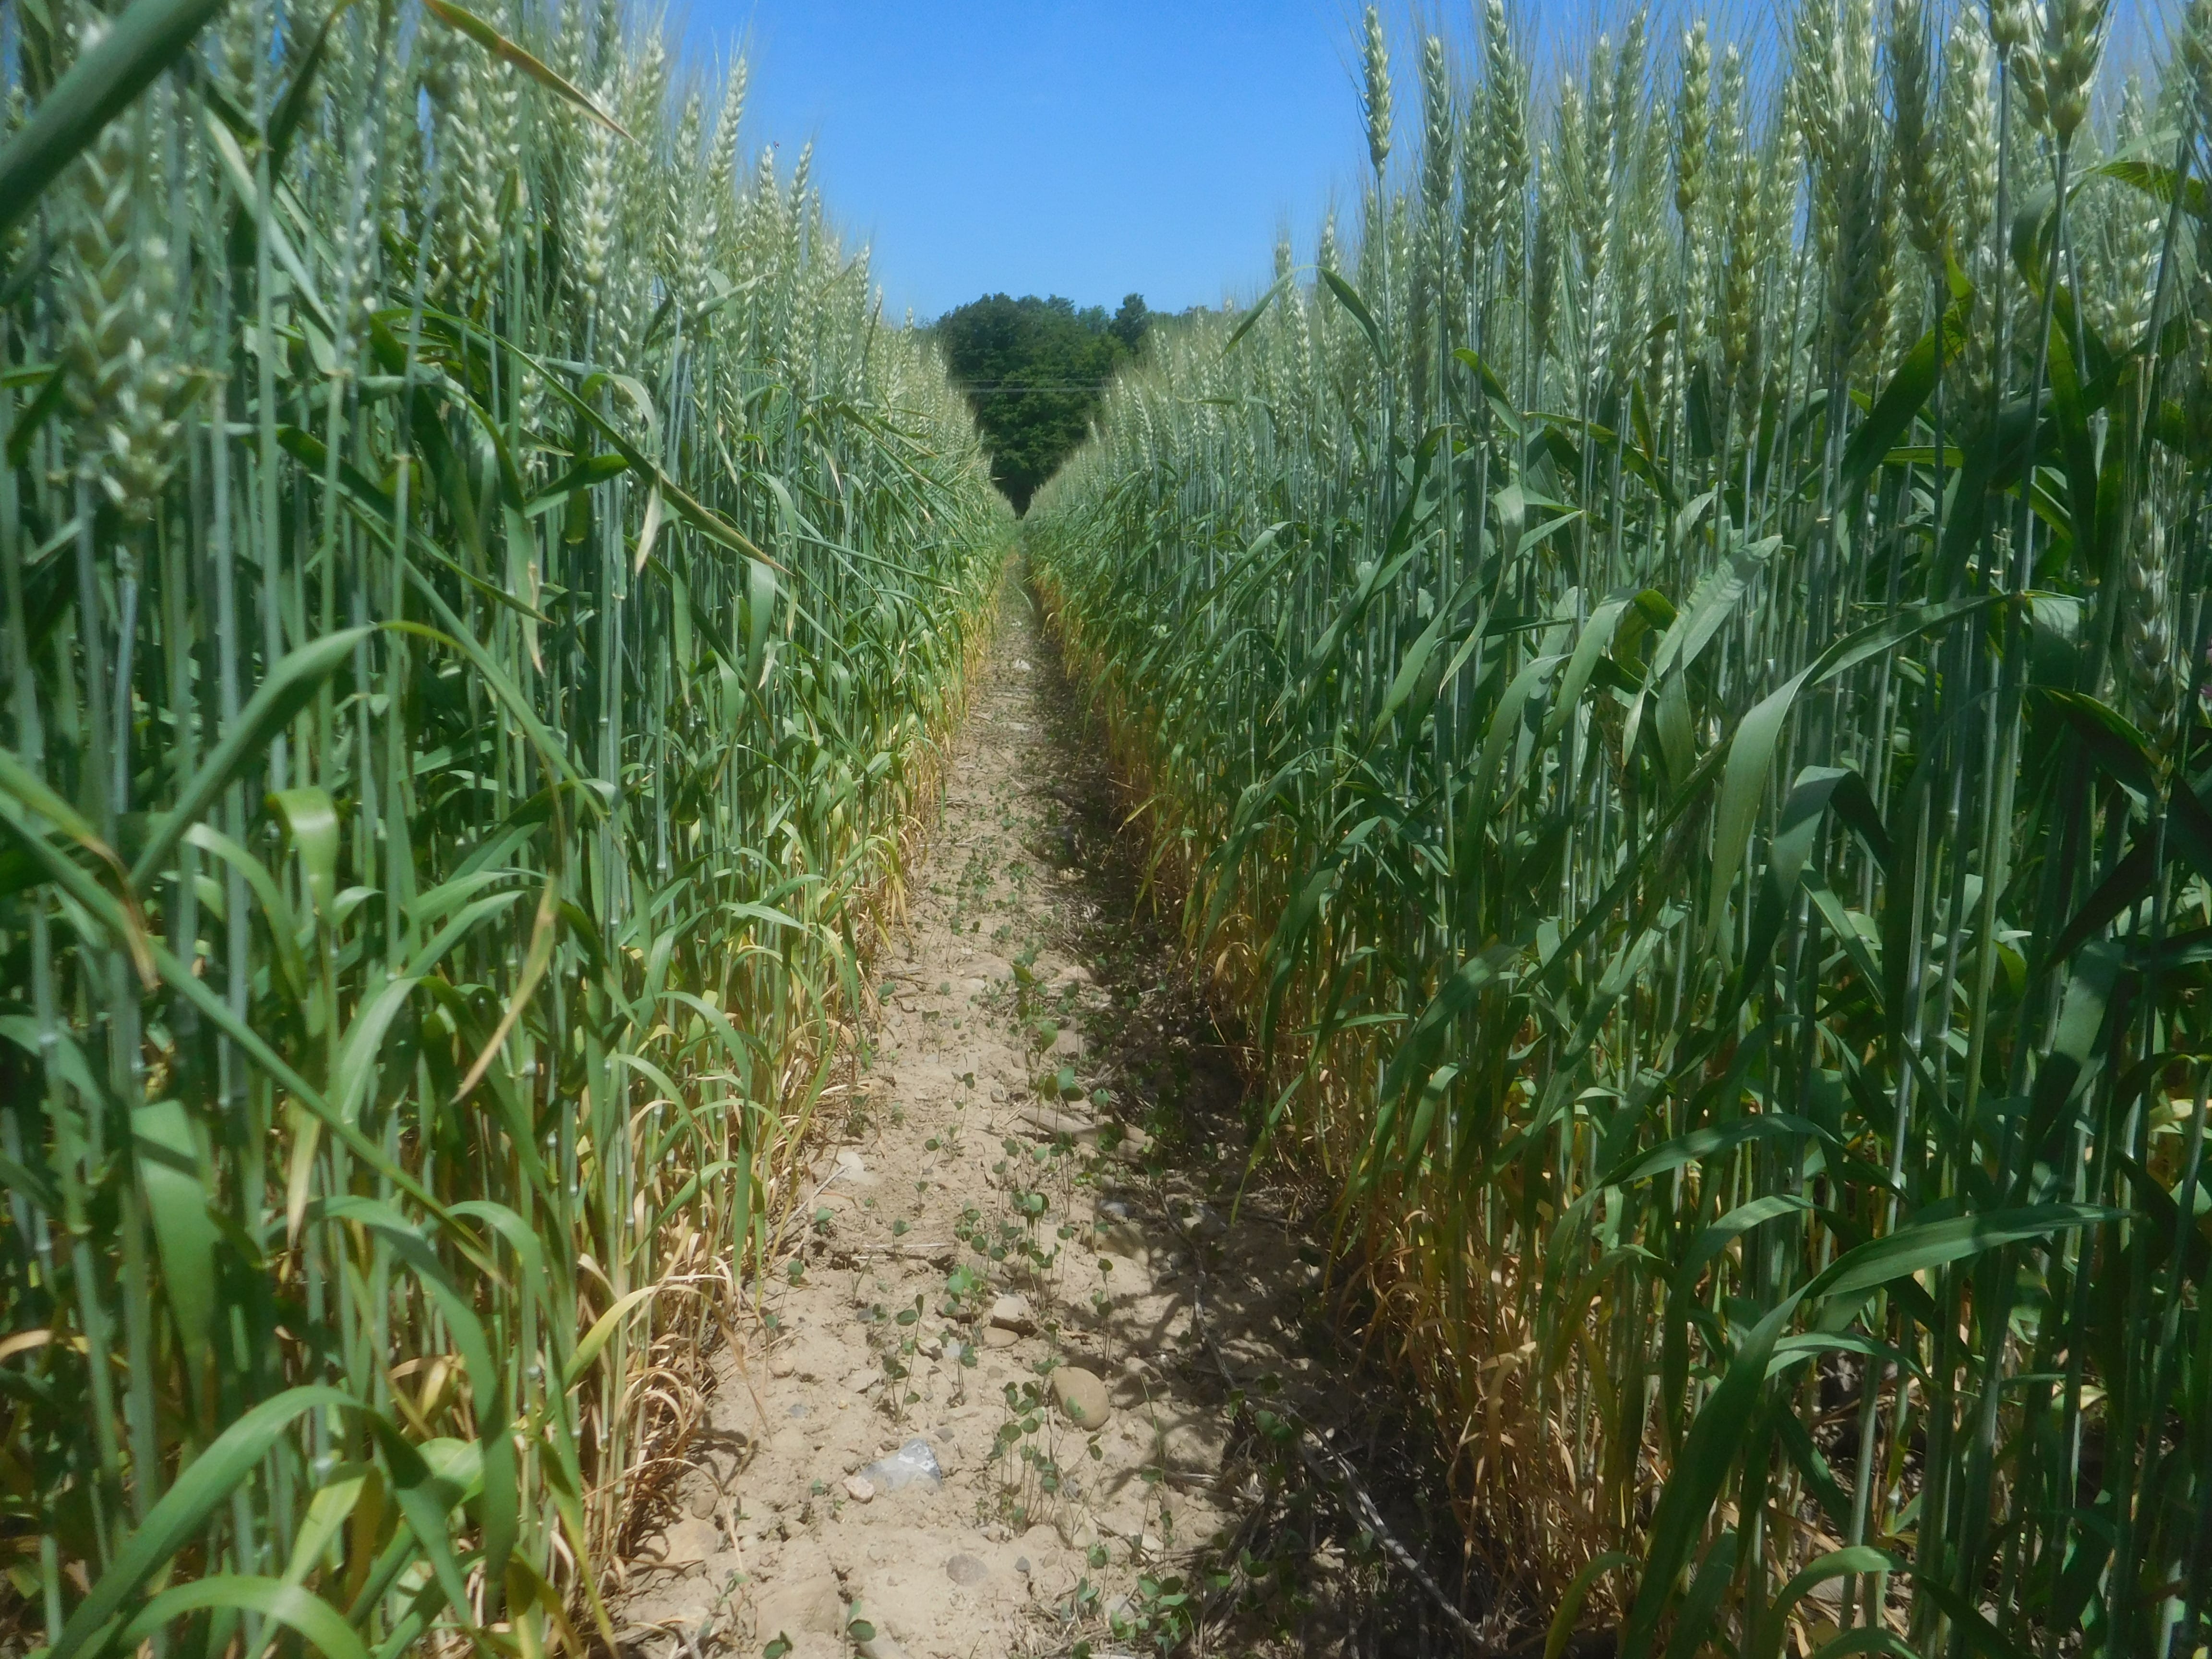
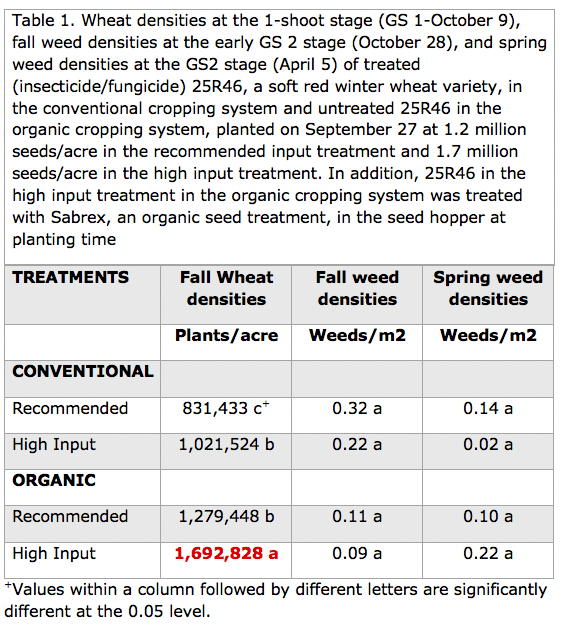
We presented data on wheat emergence as well as wheat densities and weed densities in the fall (https://blogs.cornell.edu/whatscroppingup/2017/12/01/organic-compared-with-conventional-wheat-once-again-has-more-rapid-emergence-greater-early-season-plant-densities-and-fewer-fall-weeds-when-following-soybean-in-no-till-conditions/) and weed densities in the early spring (https://blogs.cornell.edu/whatscroppingup/2018/05/25/no-till-organic-wheat-continues-to-have-low-weed-densities-in-early-spring-april-9-at-the-tillering-stage-gs-2-3/) in previous news articles. Briefly, organic wheat had more plants/acre, and similar weed densities in the fall and spring (Table 1). This is the second time that organic compared to conventional wheat no-tilled into soybean stubble had better stands and very low weed densities. Organic growers who harvest soybean fields with low winter weed pressure (dandelion, mallow, chickweed, henbit, mayweed, etc.) should consider no-tilling organic wheat, especially if the soybean field had been moldboard plowed. If soybeans were no-tilled into roller-crimped rye in early June, the rye residue could harbor significant slug/snail populations during the cool and damp fall mornings, which could impact wheat stands.
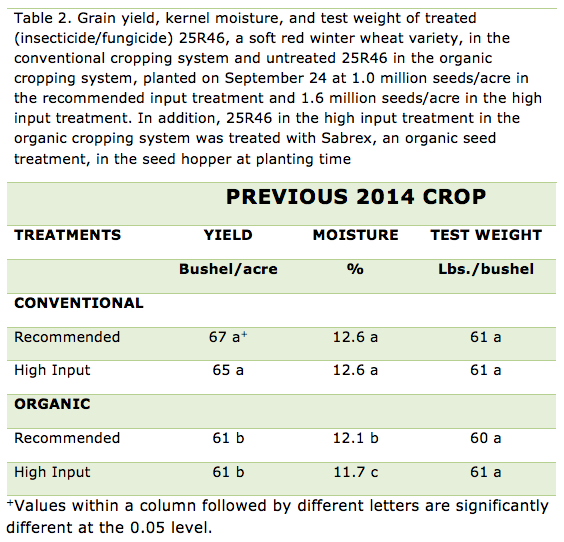
A cropping system x management input interaction was observed for wheat yield in 2018 (Table 2). Organic and conventional wheat yielded 80 bushels/acre with recommended inputs in 2018. Organic wheat showed a 6 bushel/acre response to high input management (500,000 more seeds/acre and an additional 30 lbs. of N/acre). In contrast, conventional wheat did not respond to high input management, despite 500,000 more seeds/acre, a fall herbicide application, 30 lbs. more N/acre, and a fungicide application. Once again, conventional wheat did not respond to the “new way” of managing wheat, high input wheat, which is similar to results that we have observed in all years with dry springs when we compared high and recommended input wheat in the 1980s and 2000s. Obviously, there is no need to apply additional N or apply a fungicide to wheat during dry springs because fertilizer N applied in late March or early April will not be lost to the environment via leaching or denitrification and disease pressure is low.
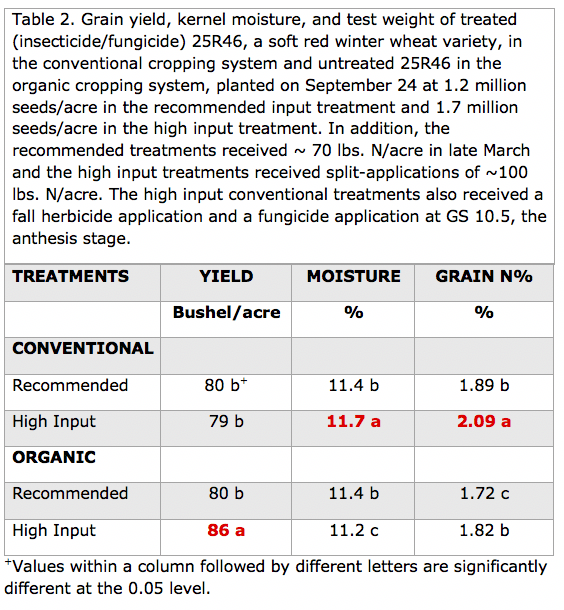
In 2016, a year with very similar precipitation patterns to 2018 (5.88 inches vs. 6.5 inches of precipitation, respectively, from April 1 through June 30), organic wheat yielded ~7.5% lower than conventional wheat when averaged across input treatments with no response to high input treatments in either cropping system(https://blogs.cornell.edu/whatscroppingup/2016/09/26/organic-wheat-looked-great-but-yielded-7-5-less-than-conventional-wheat-in-20152016/). Temperatures in May when N demand by wheat is the highest, averaged 62.0o in 2018 but only 56.5o in 2016. Cool temperatures limit N mineralization from organic sources so in 2016 we speculated that the use of an organic N source may have resulted in less available N to the organic wheat crop. Indeed, grain N% concentration in organic (1.66%) vs. conventional wheat (2.03%) was much lower in 2016 lending credence to the lack of available N as the major factor in the lower organic wheat yields. In 2018, conventional compared with organic wheat once again had greater grain N% concentration (1.99% vs. 1.77%, respectively, Table 2) but the difference was not as vast. Evidently, the warm May conditions allowed for release of adequate N from Kreher’s composted manure to maximize yields. May of 2018, however, was the second warmest on record in central and western NY. In years with cool late April and May conditions, organic wheat production may face N availability challenges because of low mineralization rates of organic N sources.
In conclusion, organic wheat yielded the same as conventional wheat with recommended inputs and yielded 9% greater than conventional wheat with high inputs. Kreher’s composted chicken manure, however, is very expensive (~$300/ton with only 5% N analysis of which we assumed only 50% N availability) so N costs approximated $6/lb. of N or ~12x higher than the ammonium nitrate source for conventional wheat. Consequently, organic compared with conventional wheat with recommended inputs probably had lower returns in 2018, despite being eligible for the organic price premium in the 4th year of this study (we will conduct a complete economic analysis of this 4-year study in late fall or spring of next year). Organic wheat with high inputs probably had similar economic returns as conventional wheat with high inputs, a common practice among some NY wheat growers, because the 12x higher cost for N in organic wheat would be offset by the higher cost for treated seed, fall herbicide application, the second N application, and late spring fungicide application in high input conventional wheat. Most organic wheat growers, however, probably use a dry solid manure source that is far less expensive than Kreher’s composted chicken manure so the economic analyses in this study will be slanted against organic wheat. On the other hand, the use of dry solid manure is far more difficult to apply precisely and at the correct time to insure availability to the wheat crop in May during stem elongation so the yield data may be slanted towards wheat in this study.