Bianca Moebius-Clune, Margaret Ball, Harold van Es, Jeff Melkonian – School of Integrative Plant Science, Soil and Crop Sciences Section – Cornell University
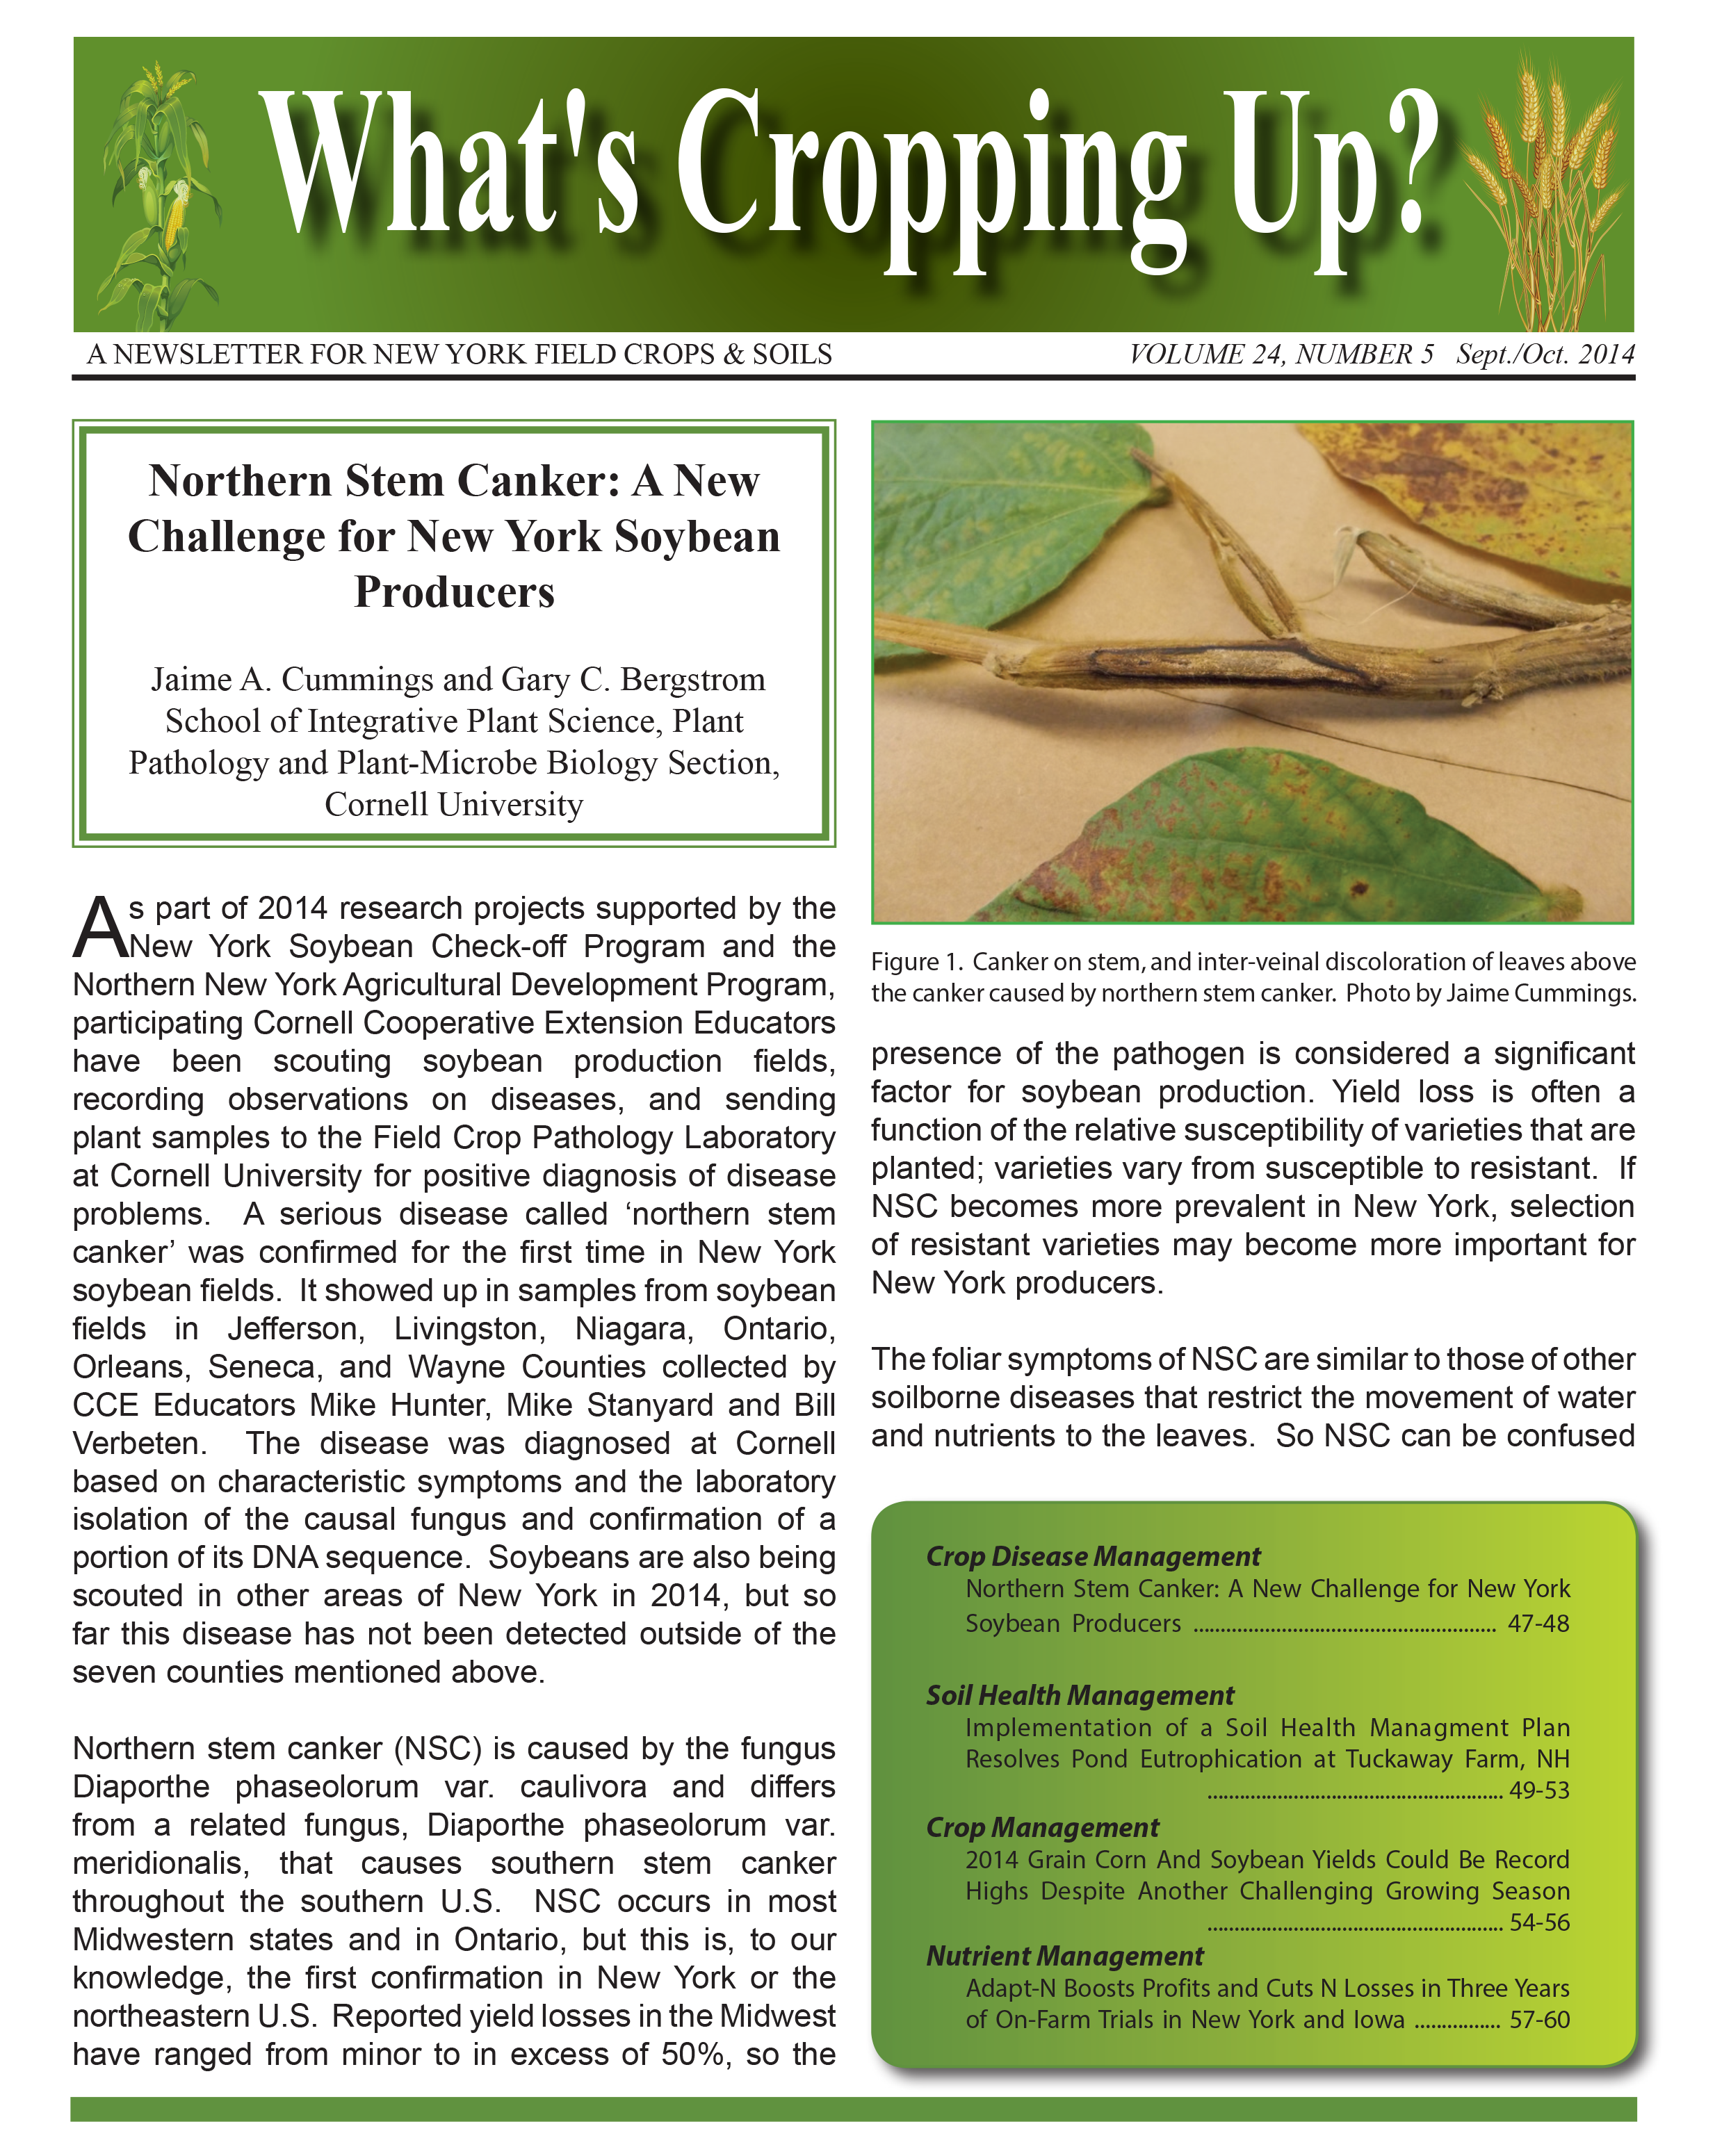
Adapt-N is an on-line tool that provides location-specific, weather-adjusted nitrogen (N) recommendations for corn. At sidedress time, critical early-season weather that strongly influences actual N needs is incorporated into the recommendation. To accomplish this, the tool uses 1) a simulation model that was developed and calibrated through field research over several decades, 2) high resolution 2.5 x 2.5 mile daily temperature and precipitation information, and 3) soil and crop management information entered via a web interface on any internet-capable device. Adapt-N’s cloud-based environment (central data server, high security, and accessibility through desktop, laptop and mobile devices, future embedding in other farm software) offers a user-friendly experience.
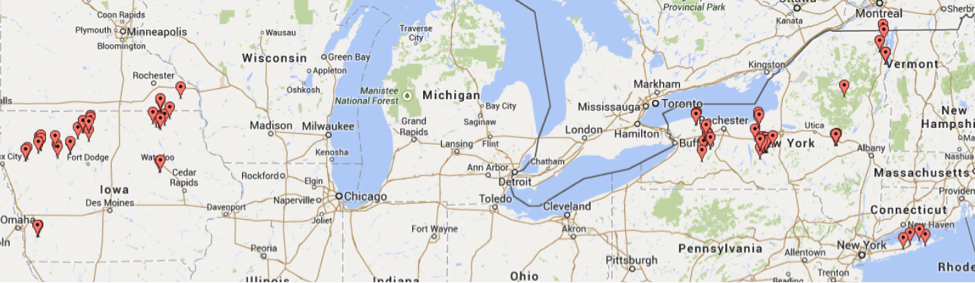
We conducted a total of 104 strip trials in 2011, 2012, and 2013 in New York and Iowa (Figure 1) to beta test Adapt-N for its ability to improve recommendations for corn N need at sidedress time. Yield data and simulated losses across trials show that the Adapt-N tool significantly increased grower profits, while decreasing N inputs and environmental losses, as summarized in this article. In 2014, Adapt-N was commercialized through a public-private partnership between Cornell University and Agronomic Technology Corporation (ATC, see http://www.adapt-n.com/). The partnership aims to sustain and broaden the tool’s availability, customer service, usability, and integration with existing farm management technologies, while allowing for continued research and development at Cornell University.
Methods
We completed 67 replicated strip trials in New York (14 in 2011; 42 in 2012; 11 in 2013) and 37 trials in Iowa (9 in 2011; 19 in 2012; 9 in 2013) on commercial and research farms throughout each state (Figure 1. One 2012 trial in Minnesota is included with the Iowa trials).
Figure 1. Map of 2011-2013 trial locations (map courtesy of batchgeo.com)
Sidedress treatments involved at least two rates of nitrogen, a conventional “Grower-N” rate based on current grower practice (G) and an “Adapt-N” recommended rate (A). An Adapt-N simulation was run for each field just prior to sidedressing to determine the optimum weather-adjusted N rate.
Table 1. Agronomic, economic and environmental assessment of model performance in 2012. Values are average differences resulting from Adapt-N use (Adapt-N minus Grower-N treatment) such that a negative number shows a decrease due to Adapt-N, a positive number shows an increase due to Adapt-N. *Simulated N leaching losses and N total losses do not include 2011 IA trials – data not available.
Yields were measured by weigh wagon, yield monitor, or in a few cases by representative sampling (two 20 ft x 2 row sections per strip). Partial profit differences between the Adapt-N and Grower-N practices were estimated using prices of $0.50/lb N, $5/bu grain, $50/T silage, and $8/ac operational savings if sidedress was avoided in either the Adapt-N or Grower treatment. Yields were used as measured, regardless of statistical significance, since the statistical power to detect treatment effects for a single experiment is inherently low.
Total N losses to the environment (atmosphere and water) and N leaching losses were simulated by Adapt-N for each N treatment, through the end of each growing season. End dates for N loss simulation were October 30, 2011 (NY trials only), December 15, 2012, and December 31, 2013.More detailed descriptions of each year’s methods and results were provided in previous WCU articles (Moebius-Clune et al., 2012, 2013, and 2014).
Agronomic and Economic Comparison
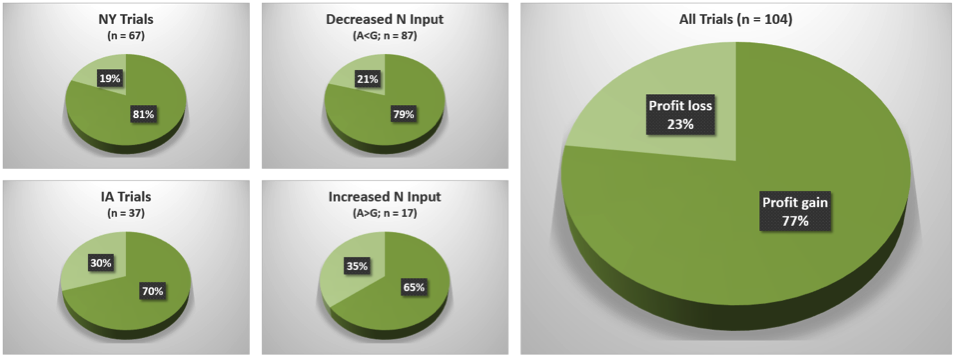
Adapt-N rates resulted in average N input reductions of 52 lbs/ac in NY, 29 lbs/ac in IA, and 44 lbs/ac overall (Table 1). Profit gains from the use of Adapt-N were considerable. Profits increased in 81% of all NY trials, in 70% of all IA trials, and in 77% overall when growers followed Adapt-N recommendations (Figure 2). Profit gains of $30/ac on average ($37/ac in NY, $17/ac in IA) were obtained most frequently due to reductions in N inputs, without significant yield loss: +1 bu/ac on average across all trials. Most collaborating growers were already using progressive N management including sidedressing, so that benefits achieved in these trials can be considered to be a conservative estimate of potential benefits of using Adapt-N. Benefits will be higher for growers who currently use few N best management practices.
Figure 2. Proportion of trials with profit gains (dark green) or losses (light green) as a result of using the Adapt-N recommendation compared to current grower N management in 2011-2013 trials. With appropriate use of the most up-to-date version of Adapt-N, success rates can be further improved.
Decreased N rates: Adapt-N recommended a lower N rate than grower practice in 84% of trials, by 60 lbs/ac on average (Table 1). Such recommendations occurred after a normal or dry spring, when N from spring mineralization or early fertilizer applications remains available to the crop. Yield losses were generally minor, averaging -2 bu/ac across trials with N reductions, and leading to profit gains in 79% of cases – on average $23/ac (Table 1, Figures 2 and 3). This implies that a grower is about four times more likely to achieve increased profit from a reduced Adapt-N rate than from their current higher rate. This statistic includes all trials over three years, although model improvements have been made each year based on trial information, such that actual probabilities of increased profit with reduced N inputs are likely further improved for future years.
Increased N rates: Even larger profit gains of $65/ac on average were achieved when Adapt-N recommended increasing N inputs over the grower’s current practice in 16% of trials. Consequent average yield increases of 17 bu/ac across these trials were achieved for an average additional 38lb/ac fertilizer application (Table 1). Such higher recommendations occurred primarily in 2013 ($94/ac profit on average in NY 2013 trials), and in select locations in other years, after a wet spring. Needs for additional N were correctly identified in 65% of these cases, resulting in significant yield and profit increases. In 35% of cases, on the other hand, the additional N was not needed. In almost all of these cases, unpredictable post-sidedress drought decreased yield potential below the expected yield that was used for the recommendation at the time the sidedress rate decision had to be made (Moebius-Clune et al., 2013).
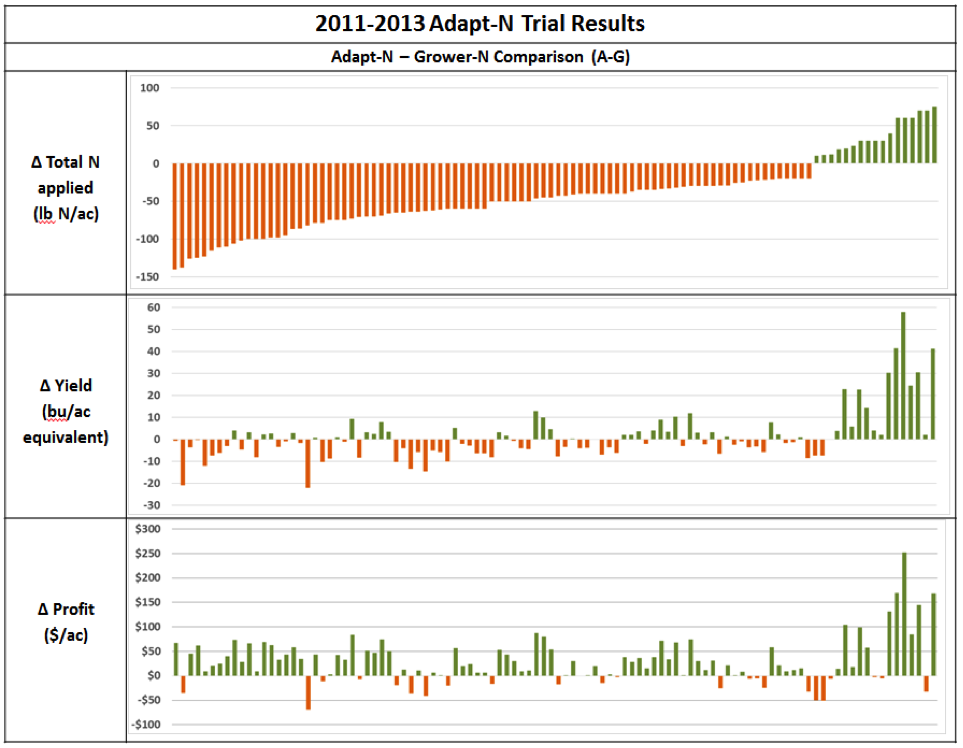
Profit loss when under-fertilizing (from reduced yields) is generally larger than when over-fertilizing (from unnecessary fertilizer application). Thus lower recommendations to account for potential future yield-limiting events cannot be justified for economical sidedress recommendations. By contrast, pre-sidedress weather events affecting yield potential and N availability are known, and Adapt-N can effectively manage this risk. Therefore, the chances of over-recommending N inputs are somewhat higher than those of under-recommending, further decreasing risk of profit loss. For illustration, overall, profit gains greater than $50/ac occurred in 29 cases, while losses greater than $50/ac were determined in only 2 cases (Figure 3).
Figure 3. Results from each trial (n = 104) are vertically aligned. Bars show difference between Adapt-N and Grower treatments (A-G) such that negative numbers (orange) show decrease due to Adapt-N, and positive numbers (green) show increase due to Adapt-N.
Environmental Benefits
Adapt-N reduced N rates in 84% of cases, by 60 lbs N/ac on average, resulting in simulated reductions in total N losses to the environment by the end of the growing season of 34 lbs/ac, and leaching losses by 10 lbs N/ac (Table 1). Further losses of residual excess N generally occur over the winter and spring months when crop uptake ceases, soil water is recharged, and saturation or near-saturation occur, particularly in the Northeast. Thus the simulated reductions are a low estimate of actual environmental loss reductions, which are likely closer to the difference in applied N. In 16% of trials, where Adapt-N increased N rates, by 38 lbs/ac on average, total N losses increased on average by only 16 lbs/ac, and leaching losses by 3 lbs/ac. Further over-winter losses in these cases are lower, because much of the additional applied N was taken up by the crop to produce the increased yield, and thus would not be lost.
Lessons for Expert Use of Adapt-N from three years in the field
Growers can decrease risk of N deficiency, environmental losses, and yield losses, and increase profit margins. To optimize Adapt-N use, we recommend the following:
Plan to apply the majority of fertilizer nitrogen at sidedress time instead of prior to or at planting. If manure is applied prior to planting or when enhanced efficiency products are used, aim for conservative rates.
Monitor the field’s N status and account for early season weather impacts on N availability by using Adapt-N’s daily updates.
Supply input information on soil and crop management that is representative of each management unit (e.g. test soil and manure based on representative samples, keep good records of operations, estimate expected yield as the second-highest out of 5 years of accurate yield information). For each management unit, measure soil organic matter at least every 3 years, ideally to a 12” depth.
If appropriate, adapt input information at the time of sidedressing to account for seasonal influences, such as decreased yield potentials or shallow rooting depths from extreme wet conditions.
Use the most recent Adapt-N recommendation available on sidedress day. Apply sidedress N between V6 and V12, depending on N and equipment availability. Generally, later sidedressing with high-clearance applicators allows for more accurate recommendations. Variable rate applicators can be used to adjust Adapt-N simulations for management units in fields.
Use Adapt-N scenario simulations after the growing season to learn more about how weather and management influence N availability.
In the long term, manage for healthy soils and use Adapt-N to account for N contributions from high organic matter levels and deep root zones.
Conclusions
Three consecutive growing seasons involving 104 on-farm strip trials demonstrate that Adapt-N is an effective tool for N management in corn systems, with average profit gains of at least $30/ac. With model improvements and increased expert use of the tool, we estimate that profit gains over current grower practices can be expected in at least four out of five cases. Adapt-N generally correctly identified cases when either decreased or increased N was needed to maintain yields. The tool also provides a strong incentive to shift N applications to sidedress time when weather impacts can be accounted for in the model. By using Adapt-N, growers can contribute to solving persistent problems with greenhouse gas emissions, groundwater pollution, and hypoxia in our estuaries, while increasing profits in both wet and dry years.
For more information: Recorded webinars, a manual, and other Adapt-N training materials are available at http://adapt-n.cals.cornell.edu/. The Adapt-N tool is accessible through any device with internet access, now from the team’s commercial partner, Agronomic Technology Corporation, at http://www.adapt-n.com/ (cost is about $1-3/ac, depending on area covered). Adapt-N users can elect to receive email and/or cell phone alerts providing daily updates on N recommendations and soil N and water status for each management unit in Adapt-N.
Acknowledgements: This work was supported by funding from the NY Farm Viability Institute, the USDA-NRCS Conservation Innovation Program, the International Plant Nutrition Institute, McKnight Foundation, Walton Family Foundation, USDA-NIFA, MGT Envirotec, and USDA-SARE. We are grateful for the cooperation in field activities from Keith Severson, Kevin Ganoe, Sandra Menasha, Joe Lawrence, Anita Deming, Harry Fefee, Kitty O’Neil, Mike Hunter, and Brent Buchanan of Cornell Cooperative Extension, Bob Schindelbeck of the Cornell Section of Soil and Crop Sciences, Mike Davis at the Willsboro Research Farm, Dave DeGolyer, Dave Shearing and Jason Post at Western NY Crop Management Association, Eric Bever and Mike Contessa at Champlain Valley Agronomics, Eric Young at Miner Institute, and Peg Cook at Cook’s Consulting in New York, and from Shannon Gomes, Hal Tucker, Michael McNeil, and Frank Moore at MGT Envirotec. We also are thankful for the cooperation of the many farmers who implemented these trials on their farms.
Bianca Moebius-Clune, Margaret Ball, Harold van Es, and Jeff Melkonian, Department of Crop and Soil Sciences, Cornell University
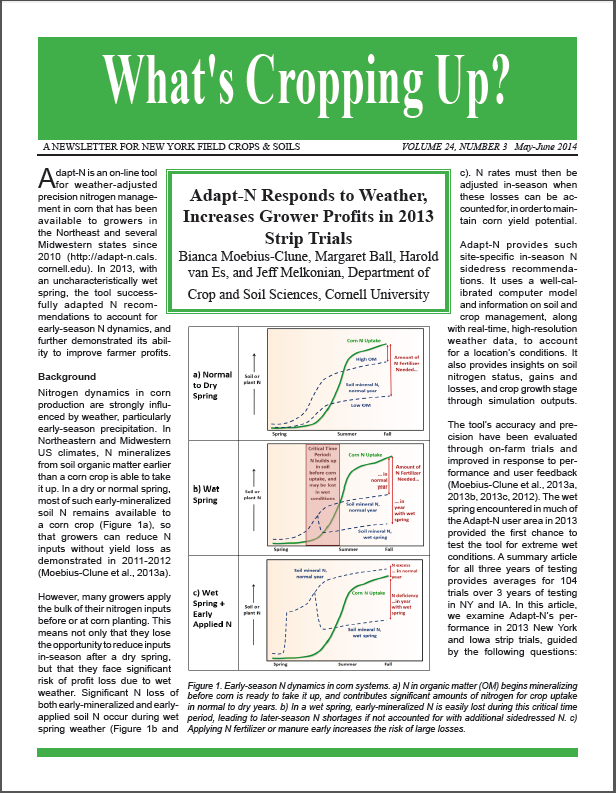
Adapt-N is an on-line tool for weather-adjusted precision nitrogen management in corn that has been available to growers in the Northeast and several Midwestern states since 2010 (http://adapt-n.cals.cornell.edu). In 2013, with an uncharacteristically wet spring, the tool successfully adapted N recommendations to account for early-season N dynamics, and further demonstrated its ability to improve farmer profits.
Background
Nitrogen dynamics in corn production are strongly influenced by weather, particularly early-season precipitation. In Northeastern and Midwestern US climates, N mineralizes from soil organic matter earlier than a corn crop is able to take it up. In a dry or normal spring, most of such early-mineralized soil N remains available to a corn crop (Figure 1a), so that growers can reduce N inputs without yield loss as demonstrated in 2011-2012 (Moebius-Clune et al., 2013a).
Figure 1. Early-season N dynamics in corn systems. a) N in organic matter (OM) begins mineralizing before corn is ready to take it up, and contributes significant amounts of nitrogen for crop uptake in normal to dry years. b) In a wet spring, early-mineralized N is easily lost during this critical time period, leading to later-season N shortages if not accounted for with additional sidedressed N. c) Applying N fertilizer or manure early increases the risk of large losses.
However, many growers apply the bulk of their nitrogen inputs before or at corn planting. This means not only that they lose the opportunity to reduce inputs in-season after a dry spring, but that they face significant risk of profit loss due to wet weather. Significant N loss of both early-mineralized and early-applied soil N occur during wet spring weather (Figure 1b and c). N rates must then be adjusted in-season when these losses can be accounted for, in order to maintain corn yield potential.
Adapt-N provides such site-specific in-season N sidedress recommendations. It uses a well-calibrated computer model and information on soil and crop management, along with real-time, high-resolution weather data, to account for a location’s conditions. It also provides insights on soil nitrogen status, gains and losses, and crop growth stage through simulation outputs.
The tool’s accuracy and precision have been evaluated through on-farm trials and improved in response to performance and user feedback (Moebius-Clune et al., 2013a, 2013b, 2013c, 2012). The wet spring encountered in much of the Adapt-N user area in 2013 provided the first chance to test the tool for extreme wet conditions. A summary article for all three years of testing provides averages for 104 trials over 3 years of testing in NY and IA. In this article, we examine Adapt-N’s performance in 2013 New York and Iowa strip trials, guided by the following questions:
1. Do Adapt-N simulations of N losses in wet-spring conditions lead to weather-adaptive N recommendations that are agronomically and economically beneficial to farmers?
2. How do the model’s recommendations affect environmental N losses in a wet season?
Methods
We completed 20 replicated strip trials on commercial and research farms, 11 in New York and 9 in Iowa during the 2013 growing season. Trials were conducted in grain and silage corn, in varied tillage systems, with and without manure application, with previous crops of corn or soybean (Table 1). Most participants applied small amounts of starter or preplant N, with the majority of total grower rates applied at sidedress. Sidedress treatments involved at least two rates of nitrogen, a “Grower-N” rate based on current grower practice, and an “Adapt-N” rate based on a simulation run just prior to sidedressing.
Table 1. Background information on 2013 on-farm strip trials implemented in NY and IA to compare current Grower N application rates with rates recommended by the Adapt-N tool.
Growers in IA and NY implemented field-scale strips with 2 to 7 (usually 4) replications per treatment. In several trials (23-25, 27, 61, 62) treatment replicates were reported as composite harvest values due to time and equipment constraints.
Yields were measured by weigh wagon, yield monitor, or in a few cases by representative sampling (two 20 ft x 2 row sections per strip). Partial profit differences between the Adapt-N recommended and Grower-N management practices were estimated through a per-acre partial profit calculation:
Yields were used as measured, regardless of statistical significance, since the statistical power to detect treatment effects is inherently low for whole-field strip trials, but averaging across many trials provides good statistical power for assessing Adapt-N performance. Prices of $0.50/lb N, $5.00/bu grain, $50/T silage were used. (Prices varied across implementation areas, but generally were close to a 10:1 price ratio). Operational costs of sidedressing ($8/ac) were accounted for where only one of the treatments was sidedressed.Agronomic, economic, and simulated environmental outcomes of these trials were used to assess Adapt-N performance.
Results
Agronomic and economic comparisons between Grower-N and Adapt-N treatments for each trial are provided for NY and IA trials in Figure 2, and as averages for agronomic, economic, and environmental performance in Table 2.
Figure 2. Yield and fertilizer use from Grower-N vs. Adapt-N treatments in a) NY and b) IA trials. N rates represent total N in lbs/acre applied as inorganic fertilizer in 2013. Partial profit gain (positive) or loss (negative) from using the Adapt-N recommendation, relative to grower’s current practices. (Yields statistically different at *p < 0.05 or **p < 0.01)
In 2013, in contrast to previous years, Adapt-N rates were higher than Grower-chosen sidedress rates in 73% of NY trials, because the most extreme rainfall occurred primarily after corn planting, in June and early July, when large amounts of mineralized N and early applied N were vulnerable to losses. In Iowa, however, Adapt-N rates were higher than Grower-chosen rates in only 22% of trials, despite the wet spring, because the most extreme rainfall occurred in May and early June, followed by fairly dry conditions in some of the user area. At that time, relatively less of the potentially available N from organic matter had mineralized. The largest losses thus occurred where corn was planted early and preplant N fertilization was high (up to 110lb/ac, trial 63), prior to extreme rainfall. This was only the case in a small number of trials.
Table 2. Agronomic and economic assessment of model performance in 2013. Values are average differences resulting from Adapt-N use (Adapt-N minus Grower-N treatment), such that a negative number indicates a decrease due to Adapt-N, a positive number indicates an increase due to Adapt-N. Profit calculations assume $5.00/bu grain, $50/T silage, $0.50/lb N, and $8/ac operational savings if sidedress was avoided. Silage yields are reported as grain equivalent (1T silage = 8.14 bu grain)
Those who sidedressed the majority of their N in June were able to avoid the extreme losses. Averaging all 20 trials conducted in NY and IA in 2013, total fertilizer applied and environmental losses did not change, while yield increased by +11 bu/ac, and profits increased by $53/ac.
NY trials.Adapt-N recommended increased sidedress rates over the grower’s normal practice in 8 out of 11 NY trials. The difference between Adapt-N recommendations and grower practice (A-G) averaged +20 lbN/ac (-60 to +70 lb N/ac). Yield increased on average by +21 bu/ac (-10 to +58 bu/ac; silage reported as grain equivalent: 1 T silage = 8.14 bu grain). In all cases where Adapt-N recommended a fertilizer increase, higher rates resulted in increased yields and profits. Overall, profits from Adapt-N recommendations increased in 9 out of 11 trials (82%), ranging from -$20 to +$252/ac with an average increase of $94/ac.
Despite significant fertilizer increases, simulated total losses of N over the season (through 12/31/2013) averaged only 8 lb N/ac higher in Adapt-N versus Grower strips (Table 2). Post sidedress losses occur if sidedress N is applied before the crop is large enough to prevent wet soil conditions through high transpiration rates, or if excess N remains at the end of the season. Most of the additional fertilizer recommended by Adapt-N was taken up by the crop after sidedressing, while N applications and losses were reduced in 3 of the trials. In two trials where profit losses did occur, we suspect that the combination of inadequately drained, compacted, poorly aggregated soils and heavy rains caused higher losses than simulated by the model.
Success stories from two growers in particular can be highlighted. Grower Arnold Richardson, working with Keith Severson of CCE Cayuga County, saw significant profit gains of over $100/ac on average from Adapt-N use this year (see Case Study in this volume, https://blogs.cornell.edu/whatscroppingup/?p=759). Dave DeGolyer of Western NY Crop Management Association established several trials of rescue N applications in July with growers Donn and Chad Branton (23-25, Fig 2). The Brantons’ standard N management places nearly all N fertilizer in a deep slot with stabilizer at planting. However, this year demonstrated that such fertilizer is vulnerable to losses during heavy rains despite stabilizer. Adapt-N indicated that more N was needed, even though enough would have been available in a normal year (Fig 1c). By sidedressing an additional 60 lb N/ac, the Brantons saw increases of 25, 42, and 58 bu/ac in three trials and profit gains of approximately $79, $164, and $246/ac due to avoided yield loss. The Brantons have decreased their preplant N applications this spring, and plan to use Adapt-N-informed sidedress rates provided by WNYCMA.
IA trials. Despite the wet spring, Adapt-N recommended fertilizer rate reductions from grower’s normal practice in 7 out of 9 IA trials, in part because most participating IA growers were planning to apply the majority of their N at sidedress. The difference between Adapt-N recommendations and grower practice (A-G) ranged from -40 to +30 lbN/ac with an average change of -19 lb N/ac. Yield changes due to Adapt-N use ranged from -4 to +14 bu/ac with an average of +1 bu/ac. Profits increased on average by $12/ac, ranging from -$6 to +$57/ac, with increases due to Adapt-N in 3 trials, no change ($0 to $1/ac) in 3 trials, and decreases in 3 trials. Simulated total N losses over the season (through 12/31/2013) were lower in Adapt-N versus Grower strips (-9 lb N/ac on average). Similarly to NY results, small profit losses in a few trials with reductions in N rates are likely due to the extreme wet conditions for which the model had not yet been field tested. Improvements in model handling of drainage have been in progress for the 2014 version of Adapt-N. Overall, the fact that Adapt-N was able to decrease N inputs even after such a wet spring without significant yield loss in these 6 trials (-1 bu/ac on average) indicates that Adapt-N accounted for losses successfully, and can inform much more significant N input reductions in Iowa during more normal or dry years, as demonstrated by our 2011 and 2012 trials, when growers plan on sidedressing. It should also be noted that predominant practice of IA growers at this time is to apply N in the fall or spring prior to planting. Such growers would have seen results most like trial 63 in IA, and trials 23-25 in NY (Figure 2), where additional N was needed to make up for rain-induced losses, with increased profits above $50/ac likely.
Figure 2b
Conclusions
2013 on-farm testing in NY and IA further demonstrated the monetary and environmental value of using Adapt-N’s weather-adjusted recommendations.
Key Take Home Points:
Environmental losses due to Adapt-N recommendations in 20 trials, on average, did not increase over grower practice in the wet 2013 season.
Yields increased by 11 bu/ac on average (21 bu/ac in NY, 1 bu/ac in IA).
Profits increased by $53/ac ($94/ac in NY, $12/ac in IA).
In 75% of trials Adapt-N increased or maintained profits compared to grower practice. The model’s ability to handle the impacts of poor drainage has been further improved for 2014.
2013 results demonstrate the value of site-specific, adaptive recommendations provided by Adapt-N. The tool’s site-specific recommendations successfully identified opportunities for N input reductions where possible, and N input increases where agronomically necessary to maintain yield potential following a wet spring.
Results, especially in IA, conservatively estimate possible profit gains in a wet year, because most collaborating growers sidedress the majority of their N. Profit were highest when compared to more common grower practices of large or total preplant applications.
This third year of on-farm testing further confirms the significant advantages growers have when they apply the majority of their N at sidedress time, when economically optimum N rates can be better estimated.
For more information: An in-depth 2014 training webinar on Adapt-N, manual, and further information are available at http://adapt-n.cals.cornell.edu/. The Adapt-N tool can be used from any device with internet access, and as of the 2014 sidedress season is offered through a public-private partnership between Cornell University and Agronomic Technology Corporation for a fee ($1-3/ac, depending on area covered). Users can sign up for an account at http://www.adapt-n.com/products/, and can elect to receive email and/or cell phone alerts providing daily updates on N recommendations and soil N and water status for each management unit being simulated in Adapt-N.
Acknowledgements: This work was supported by funding from the NY Farm Viability Institute, the USDA-NRCS Conservation Innovation Program, the International Plant Nutrition Institute, McKnight Foundation, and MGT Envirotec. We are grateful for the cooperation in 2013 field activities from Keith Severson, Joe Lawrence, Anita Deming, Harry Fefee, Kitty O’Neil, Mike Hunter, and Brent Buchanan of Cornell Cooperative Extension, Bob Schindelbeck of the Cornell Department of Crop and Soil Sciences, Mike Davis at the Willsboro Research Farm, Dave DeGolyer, Dave Shearing and Jason Post at Western NY Crop Management Association, Eric Bever and Mike Contessa at Champlain Valley Agronomics, Eric Young at Miner Institute, and Peg Cook at Cook’s Consulting in New York, and from Shannon Gomes, Hal Tucker, and Frank Moore at MGT Envirotec. We also are thankful for the cooperation of the many farmers who implemented these trials on their farms.
Ball, M., B. Moebius-Clune, H. van Es, J. Melkonian, K. Severson. 2014. New York Farm Delves Deeper with Adapt-N. What’s Cropping Up? blog. [URL verified 6/2/2014].
Margaret Ball, Bianca Moebius-Clune, Harold van Es, Jeff Melkonian, Department of Crop and Soil Sciences, Keith Severson, Cayuga County Cooperative Extension, Cornell University
Arnold Richardson has had his eye on Adapt-N since 2009, when the tool for weather-adapted sidedress nitrogen recommendations first became available. Of a self-described “competitive nature,” the Red Creek, NY farmer is constantly seeking and testing new strategies that can improve his farm system and boost yields and profits. After several years of watching the development of Adapt-N and its success in early on-farm trials, Richardson conducted strip trials of the Cornell nitrogen management tool in three fields in 2013. All three trials increased his yield and profit, and of course, got him thinking about what improvements to make next.
The Richardson Farm crew (left to right): Arnold, Eric, and Ryan Richardson and Nick Humphrey.
Richardson and sons grow grain corn and soybean on 1000 acres near the border of Cayuga and Wayne counties. The mix of rich river bottom loams and stony clay drumlins in their fields requires flexibility and ingenuity in management. The team has significantly changed management practices since inheriting the farm several decades ago. They switched from continuous corn to a corn-soybean rotation, which gave an immediate 20 bu/ac yield bump on corn, says Arnold. They’ve also experimented with various primary tillage tools, switching from moldboard to chisel plow in 1983, then testing strip till, aerator, and most recently “vertical tillage” tools over several years to see what works best in their system. Most recently, the farm’s experiments have included increased seeding rates and a review of their nitrogen management practices.
The Richardsons have long taken a weather-conscious approach to nitrogen management decisions, applying most N as sidedress to better match the timing of crop uptake. “That’s the best time,” says Arnold. “The corn is making big decisions about its future at the 5 – 8 collar stage. We try to help it make good decisions… We’ve got to keep the corn happy all the way through.” They follow a general rule of 1 lb N per 1 bushel expected yield, adjusting for N use efficiency and soybean credits, for an average of around 150 lb N per acre per year over the whole farm. Understanding that weather influences N dynamics, the Richardsons even split their N into earlier and later sidedress applications on sandier fields, to minimize the risk of leaching losses with rain. They ran a few Adapt-N simulations in previous years, usually coming up with recommendations that were lower than or similar to their own rates. However, they had not adjusted their total N rates based on weather until they tested Adapt-N in the field last year.
Keith Severson of Cayuga County Cooperative Extension guided the Richardsons in establishing three Adapt-N strip trials in 2013. The trials were conducted in corn grain following soybean, on Williamson and Ontario silt loams with 2.6% to 3.8% organic matter. All trials received 22 lb N/ac in starter, following the farm’s normal practice. The third trial also received an extra 50 lb N/ac in May, because Richardson wanted to test a practice more similar to that of his neighbors, who apply more of their nitrogen early. Two treatments, replicated four times, were implemented in late June to compare Adapt-N-recommended and Grower-chosen sidedress rates. Due to the unusually wet spring, N leaching and denitrification losses (simulated by Adapt-N) were high. Adapt-N thus recommended sidedress rates 20, 30, and 40 lb/N higher than Richardson’s chosen rates. Yields increased significantly with the higher N rates in all three trials, with gains of 23 to 30 bu/ac. At Richardson’s actual prices ($0.75/lb N and $5.00/bu corn), this translates to profit gains of $91/ac to $122/ac from the use of Adapt-N. Total yields in the trial strips ranged from 162 to 222 bu/ac. As well as implementing the trials, Richardson also followed Adapt-N recommendations on the rest of the farm’s acres, “which resulted in a larger N bill than originally planned, but with a pleasing result yield wise,” he says. One Adapt-N trial plot earned the farm fourth place in the Finger Lakes section of New York State Corn and Soybean Growers’ Association 2013 Yield Contest, at 232 bu/ac.
Yield and profit increases with Adapt-N recommended rates * Difference of Adapt-N minus Grower. Positive number shows increased N applied due to Adapt-N ** Profit calculation using farm’s actual prices ($0.75/lb N and $5.00/bu corn) *** p values below 0.05 are statistically significant (real) yield differences
Richardson’s experience was typical of Adapt-N trials in New York last season. In 8 out of 11 NY 2013 trials, Adapt-N increased N rates over grower practice. Across all trials, growers saw their yields increase by an average of 21 bu/ac with Adapt-N rates 20 lb/ac higher than grower-chosen rates, resulting in profit gains of $94/ac (10:1 price ratio, silage reported as grain equivalent). Adapt-N was able to adjust N rates upward by using site-specific high resolution climate data to simulate the year’s unusually wet spring conditions, and the resulting large leaching and denitrification losses of early-applied fertilizer and early-mineralized organic N. By contrast, in the more normal springs of 2011-2012, Adapt-N simulations were able to correctly identify higher N availability from the same sources. In 56 trials in these years, New York growers gained $31/ac on average by cutting back on 66 lb/ac of unnecessary N applications.
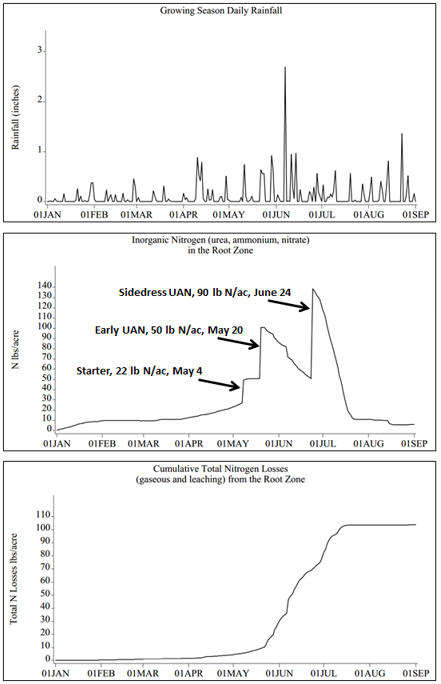
While yield and profit gains are a convincing incentive for the Richardsons to continue to use Adapt-N, the value of Adapt-N runs deeper than just financial on the Richardson farm. Arnold and sons were struck by the tool’s graphs of soil N availability and rainfall, which clearly showed the farm’s weather-related early N losses. Arnold has also “gotten into these what-if scenarios quite a bit,” regularly using his Adapt-N account to play with different management schemes and retrospective simulations.
Graphic output from Adapt-N, showing rainfall, root-zone inorganic nitrogen, and cumulative N losses in one of Richardson’s trials. The large early-season losses are typical of a wet spring.
The biggest lesson in Arnold’s eyes, however, has come from three Cornell Soil Health Test samples that the Richardsons submitted as part of their Adapt-N trials. The farm’s chemical analysis scores were perfect due to years of careful soil test-based management, but new biological and physical measures like aggregate stability, subsurface hardness, and active carbon ranked lower on the test’s scales. “I look at these reds and yellows and think, this is our next project,” said Arnold, indicating his scores for biological and physical measures of soil health. “To help get me to the next level, I’ve got to pay attention.”
For more information: An in-depth 2014 training webinar on Adapt-N, manual, and further information are available at http://adapt-n.cals.cornell.edu/. The Adapt-N tool can be used from any device with internet access, and as of the 2014 sidedress season is offered through a public-private partnership between Cornell University and Agronomic Technology Corporation for a fee ($1-3/ac, depending on area covered). Users can sign up for an account at http://www.adapt-n.com/products/, and can elect to receive email and/or cell phone alerts providing daily updates on N recommendations and soil N and water status for each management unit being simulated in Adapt-N.
Bianca Moebius-Clune1, Maryn Carlson1, Daniel Moebius-Clune1, Harold van Es1, Jeff Melkonian1 and Keith Severson2, 1 Department of Crop and Soil Sciences, Cornell University and 2 Cornell Cooperative Extension Cayuga County
Farm Background
Donald and Sons Farm in Moravia, NY grows about 1,300 acres of corn and soybean annually. Robert and Rodney Donald have been practicing variable rate N application for a number of years, taking advantage of their RTK-GPS system for soil sampling, input applications and yield monitoring. Until 2011, the farm used N application rates recommended by A&L Great Lakes Laboratories, based on soil tests done by field management unit. The Donalds applied the bulk of their fertilizer N at sidedress time, as they knew that early season applications run the risk of losses during wet springs. Recommendations ranged across their farm from 195 to 260 lbs of total N per acre, of which the Donalds applied 22 at planting. In 2011, they spent $107,000 on N fertilizer – four times what they spent in 2000, due to increasing prices and a shift toward ever-higher recommended rates as yield potentials increased.
These large expenditures were a strong incentive to seek new tools to optimize application rates. As Rodney put it, “Money talks…and with what we are getting in corn for what we are putting on in ammonia, we’re not gaining.” In 2011, the Donalds decided to collaborate on the NY state-wide Adapt-N beta-testing effort. After the dry spring, the Adapt-N recommendation for their trial field was only 80 lbs N/acre, while their standard recommendation was 220 lbs N/acre. To their surprise, there was no yield penalty from reducing the N rate by 140 lbs N/acre. In state-wide trials, 2011 Adapt-N results were also very promising: 86% of trials showed higher profits using the Adapt-N rate, with an average increased profit of $35/acre (Moebius-Clune et al, 2012).
“I was pretty amazed with the program,” said Robert, who decided to participate in a workshop on Adapt-N at Cornell University in March 2012. He added, “Once you get the hang of the program it’s easy to use.”
The Adapt-N tool is transforming the way N recommendations are made by using high-resolution climate data and a dynamic simulation model to provide weather-adjusted, site-specific, in-season nitrogen recommendations. What sets Adapt-N apart from other methods for determining crop N needs is its explicit accounting for the interaction between early season weather and other factors like soil characteristics and management decisions. After a dry spring, N that has mineralized from organic sources or was applied early in the season remains available in the soil, so less needs to be sidedressed. But in a wet spring, N is easily lost from the system and thus more fertilizer N must be applied. That difference between years could be as much as 100 lb N/ac. Not only does such unmanaged uncertainty cut deeply into growers’ profits, but the environmental consequences are significant: leaching of excess nitrate affects water quality, and denitrification contributes to emissions of nitrous oxide, a potent greenhouse gas, that also depletes the ozone layer. Realizing that recommendations from Adapt-N could lead to significant savings for the farm (estimated at $70,000 for 2011 after a very dry spring with low losses) the Donald Brothers decided they were on board.
Anhydrous sidedress rig ready to head to the field.
Whole Farm Implementation of Adapt-N Rates
For the 2012 growing season, the Donalds used Adapt-N on their whole farm and implemented numerous trials. Robert entered the farm’s 90 management units into his account that spring via the user-friendly Adapt-N interface. “I spent one Saturday afternoon and all day on Sunday,” Robert noted. Between June 8 and 21, Rodney sidedressed 922 acres of corn, using their RTK-GPS system to target their variable rates. Recommendations from Adapt-N varied from 65 to 190 lbs N/acre among management units, depending on local temperature, precipitation, soil texture and organic matter content (varying from 1-6%), as well as the date of sidedressing. On each day of sidedressing, Robert entered updated N recommendations into their system (provided by the daily automatic Adapt-N sidedress alerts) for the fields to be sidedressed that day. He transferred this information to their calibrated RTK-GPS-guided anhydrous ammonia sidedresser via a USB device to automatically adjust N rates on-the-go.
Adapt-N data card used with RTK-GPS on 922 acres of corn. Check strips sidedressed with “Old Way” data card that contained their conventional rates.
Rodney sidedressed entire fields with the Adapt-N rate, except for single or replicated comparison strips of the conventional “old” rate implemented on 15 of their 18 corn fields. Most of the strip trials followed an AOOA design (with “A” representing the Adapt-N rate and “O” representing the old rate).
Agronomic, Economic and Environmental Results N rates as applied and yield monitor data for each trial area were retrieved from the Donalds’ AgLeader software at the end of the season. Yields and fertilizer application rates were visualized in map format and quantified within management units or as field-length strips.
Based on analysis of GIS data from the entire farm, Adapt-N resulted in profit gains in 83% of the trials. Averaged across all trials, savings were approximately $42/ac, with estimated total savings of over $30,000 for the farm after the fairly normal 2012 spring. Fields reached or exceeded the estimated yield potential in almost all cases, indicating that the Adapt-N recommended rates were high enough to achieve the expected yield. Yield losses were negligible (2 bu/ac) despite N fertilizer reductions by an average of 87 lbs/ac across all 24 fields. Yield maps visually emphasized the lack of yield response in the higher N rate strips for almost all trials, as well as the potential impact of field variability on harvest yield.
Left: N application map for Trials 48-50 retrieved from calibrated anhydrous sidedresser – the green strip indicates the high rate grower-N strip, and the grey rectangle indicates a zero-N section (data not discussed here). Right: Yield map retrieved from calibrated yield monitor, with no visually apparent yield increase with higher Grower-N rate.Comparison of yield and profit using the “Old” N application rates vs. those recommended by Adapt-N. N rates represent total N in lbs/ac applied as inorganic fertilizer in 2012.Percent of trials with profit gain resulting from reduced Adapt-N rate (20 trials, $55/ac), profit losses resulting from underestimated expected yield input (4 trials, -$27/ac), and trials with unexplained profit losses (none).
The only cases of profit loss occurred in four trials, all exceeding the expected yield by up to 35 bu/ac. Yield losses could have been minimized with more precise expected yield inputs; the Donalds had entered a flat yield potential of 200 bu/ac for all fields, rather than basing the input on past field-specific yield records. Adapt-N is a precise tool that already accounts for the risks of uncertainty and differential losses from over and under-fertilization. Therefore, a good estimate of expected yield is critical to attaining accurate N recommendations.
Savings from whole-farm implementation of Adapt-N were coupled with significant environmental benefits. Informed by Adapt-N, the Donalds applied a non-area-weighted average of 87 lbs/ac less than recommended by A&L Laboratories across the implemented trials. The decrease in N applications reduced simulated total environmental N losses (until 12/15/2012) by an average of 70 lbs/ac, and reduced N leaching losses by an average of 10 lbs/ac. In total, they saved about 67,000 lbs of unneeded N in 2012.
Refining Adapt-N Use in 2013
When asked whether they were planning to use Adapt-N again next year, Robert answered with an unequivocal “Oh yeah!” and added, “Gotta refine our use of the tool some.” Robert recognizes that for a precision tool like Adapt-N, a reasonable expected yield is particularly important. One of the biggest things Robert plans to change: He will use variable estimated yields for each management unit in 2013, based on 3 to 5 years of yield records for each management unit. He noted that one of his fields in Scipio, NY “won’t do 175 in the best of years. That’s where N is wasted,” while, “other fields can regularly reach 250 bu/ac” if given enough nitrogen. Also, he plans to use the new soil series name inputs that became available last June to further improve the precision of the recommendations.
The trials implemented at Donald & Sons Farm have greatly helped the team assess Adapt-N’s performance and demonstrate the efficacy of using the tool in conjunction with GPS equipment. Growers with similar technological capabilities can likewise maximize the potential of Adapt-N to improve their profits and reduce N inputs and losses.
More information. Adapt-N supporting publications, an in-depth training webinar, and access to the web-interface are available at http://adapt-n.cals.cornell.edu. This case study has been supported by funds from New York Farm Viability Institute, the USDA-NRCS Conservation Innovation Program, and the International Plant Nutrition Institute.

 The full version of What’s Cropping Up? Volume 24, No. 5 is available as a downloadable PDF. Individual articles are available below:
 such that a negative number shows a decrease due to Adapt-N, a positive number shows an increase due to Adapt-N.")