Bill Cox, Eric Sandsted, and Phil Atkins
Soil and Crop Sciences Section, Horticulture Section, NY State Seed Improvement Project – Plant Breeding and Genetics Section; School of Integrative Plant Science, Cornell University
We initiated a 3-year study at the Aurora Research Farm in 2015 comparing the corn, soybean, and wheat/red clover rotation under conventional and organic cropping systems during the 3-year transition period (2015-2017) from a conventional to an organic cropping system. We used three entry points or previous crops to initiate the study: 1) small grain, 2) grain corn, and 3) soybean experimental areas in 2014. Two of the many objectives of the study are to determine the best previous crop and the best crop to plant in the first year of the transition from conventional to organic cropping systems. Both cropping systems are being compared under recommended and high inputs (high seeding and N rates, and fungicide under high input in conventional; high seeding and N rates and seed treatment under high input in organic).
We planted corn and soybean on May 23 after mold-plowing on May 22 and culti-mulching the experimental areas on the morning of planting. We planted the treated GMO corn hybrid, P96AMXT, in the conventional plots; and the isoline, untreated non-GMO, P9675, in the organic cropping systems at two seeding rates, ~30,000 and 35,000 kernels/acre. In the organic cropping system, we also treated P9675 in the seed hopper with Sabrex, an organic seed treatment with Tricoderma strains in the high input treatment. We used a White Air Seeder to plant both hybrids.
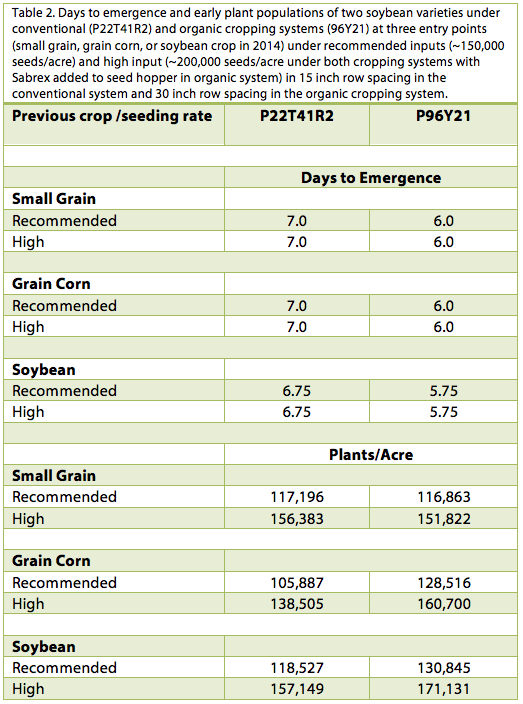
We also used the White Air Seeder to plant the treated GMO soybean variety, P22T41R2, and the non-treated non-GMO, 92Y21, at two seeding rates, ~150,000 and 200,000 seeds/acre. As with corn, we treated 92Y21 in the seed hopper with the organic seed treatment, Sabrex, in the high input treatment (high seeding rate). Unlike corn, however, we used different row spacing in the two cropping systems with the typical 15” row spacing in the conventional cropping system and the typical 30” row spacing (for cultivation of weeds) in the organic cropping system. Consequently, in comparing days to emergence and the early plant populations of the two crops under two cropping systems, the soybean comparison is not as robust as the corn comparison because of the different row spacing and genetics between soybean varieties in the two cropping systems.
Weather conditions were warm and dry for the first 7 days after planting. Corn emergence (50% of the plants emerged) varied between conventional and organic cropping systems but not between inputs within a cropping system (Sabrex in the high input organic cropping system). For all three entry points (previous crop), corn emergence in the conventional cropping system occurred earlier in the conventional cropping system, including 1 day earlier in the small grain entry point (Table 1).

Weed densities were very low following all previous crops but some weeds were observed in the “white thread’ stage (just germinating below the soil surface) following grain corn so we estimated early plant populations in all treatments on June 4th in the corn entry point before tine weeding in the organic cropping system on June 5th. Most but not all of the corn was up so these plant populations are preliminary. We will estimate plant populations again after the last cultivation in the organic cropping system and again just before harvest. Nevertheless, corn plant populations in the conventional vs. organic cropping system were ~1000 plants/acre higher at the recommended seeding rate (~30,000 kernels/acre) and more than 3000 plants/acre higher at the higher seeding rate (Table 10. The hybrid, P9675, had ~85% early emergence with or without Sabrex. Again, these are preliminary counts but more corn plants got out of the ground faster in the conventional compared with the organic cropping system. It is not clear whether the GMO traits (Bt root worm, etc.) or seed treatment (fungicide and insecticide) contributed to the differences.
In contrast, soybean emergence was consistently 1 day earlier in the organic vs. the conventional cropping system for all three entry points (Table 2). We took early stand counts for all three entry points on June 4 because we planned to tine weed all the soybean plots on June 5 (but only tine-weeded the organic soybeans in the grain corn plots). The variety, P96Y21, in the organic cropping system had greater plant populations compared with P22T41R2, when following grain corn and soybeans but not following a small grain. It is not clear why there was a difference between the two cropping systems when following soybeans and grain corn but not thesmall grain. Likewise, it is not completely clear why P92Y21 emerged earlier than P22T41R2 but P92Y21 did have a higher field emergence score (8 on the Pioneer 1-10 scale) compared with P22T41R2 (7 score). The varieties were also planted in different row spacing in the conventional (P22T41R2 in 15 inch rows) and organic cropping system (P92Y21 in 30 inch rows), which may have allowed the organic soybean treatment to “work together” in the thickly planted row to emerge quickly. As in corn, Sabrex seed treatment in the organic cropping system did not hasten days to emergence nor significantly affect % early stand establishment. Again, these are preliminary plant population estimates but more soybean plants got out of the ground faster in the organic compared with the conventional cropping system when grain corn and soybeans were the entry points in the transition to organic cropping systems.
In conclusion, corn emerged earlier in conventional compared with the organic cropping system. About 1000 more plants/acre in the conventional vs the organic cropping system were estimated 12 days after planting when grain corn was the entry point or previous crop in 2014. We will estimate corn populations again after the last cultivation in the organic cropping system and again just before harvest. It is not clear if the early emergence and higher early plant populations were associated with the GMO trait (Bt rootworm) or seed treatment (fungicide and insecticide).
In contrast, soybean emergence was more rapid in the organic compared with the conventional cropping system at all three entry points, perhaps because the variety (96Y75) had a higher field emergence score compared with P22T41R2. Likewise, early plant populations before tine weeding were higher in the organic cropping system compared with the conventional cropping system in the soybean and grain corn entry points but not in the small grain entry point. Again, these are preliminary estimates and we will estimate soybean populations just before the first cultivation and again just before harvest.


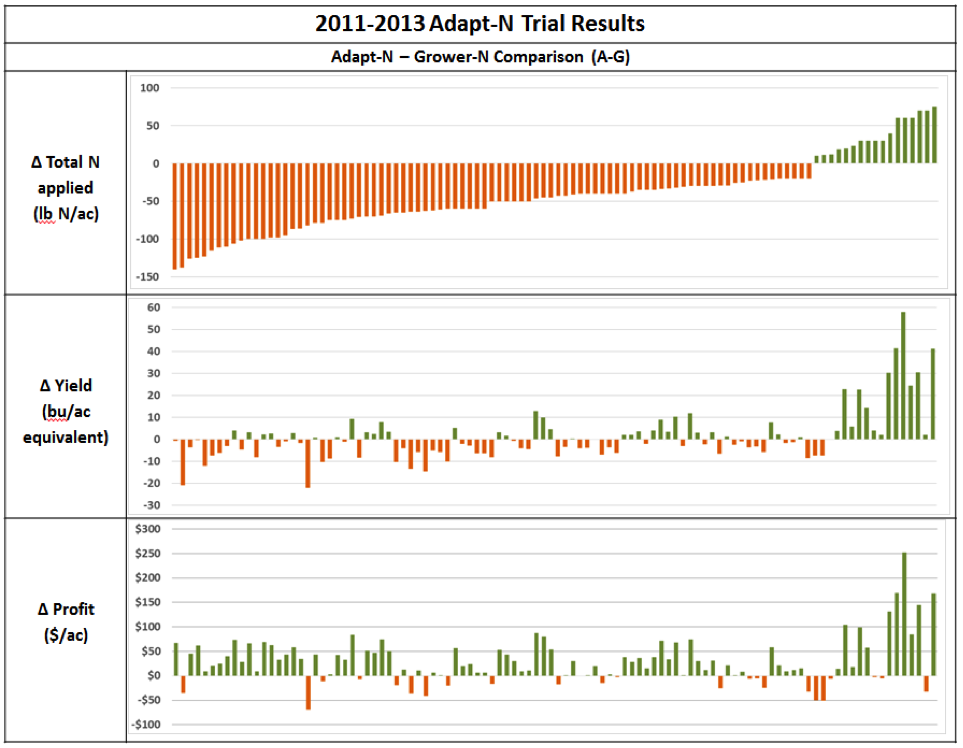
 such that a negative number shows a decrease due to Adapt-N, a positive number shows an increase due to Adapt-N.")