Buckwheat, a historic crop with modern opportunities

Thomas Björkman, Section of Horticulture, Cornell University

Buckwheat with flowers isolated.

Buckwheat is a historic crop in New York and Pennsylvania that is seen higher demand as a gluten-free food, and is financially attractive when commodity-crop prices are at today’s low. This article provides an update on the organization of the American buckwheat industry and some thoughts on how the crop fits in New York agriculture.

Recent interest in gluten-free foods has driven an increase in demand for buckwheat. The largest supplier of buckwheat to US food markets is The Birkett Mills right here in Penn Yan, NY. Birkett Mills has needed to contract supplies further from their mill in order to meet that demand. This year they have significant contracts as far away as Minnesota and Prince Edward Island. Their demand could be met much closer to home if more New York farmers raised it.

The Birkett Mills has a long history in this area. It was founded in 1797 as a water driven mill at the outlet to Keuka Lake. At that time, many mills were established in central New York as the region was settled by Europeans. Birkett Mills has the distinction of being one of the few mills that remains, and is still in the original location.

Some of the buckwheat flour is used to make the iconic buckwheat pancakes, but that is far from the only use. A substantial amount becomes roasted groats, called kasha, a staple of Eastern European cuisine. The company’s kasha is available in grocery stores nationally. Buckwheat meal, similar to cornmeal or cream of wheat, is used as an ingredient by food manufacturers. It is sold as “Cream of Buckwheat” breakfast cereal, but this versatile product is also used to make polenta. Polenta is well known in northern Italian cuisine is a corn dish. But before North American corn came to Italy, it was made with buckwheat.

There is one other mill of significance producing food ingredients from buckwheat, Minn-Dak in North Dakota. Much of their production is shipped to Asia. Two large growers in eastern Washington State export all of their production to Asia as whole grain. There are also a handful of small mills in the East that mill a few acres of buckwheat. Overall, the buckwheat marketing is highly concentrated.

There is also a thriving buckwheat seed industry to provide seed for cover crops and wildlife food plots. One of the major producers in this arena is seed way. They processed buckwheat at the historic AgriCulver mill south of Mecklenburg in Schuyler County. That mill served many growers in the Southern Tier when buckwheat was one of the primary crops in the region in the late 19th century.

Buckwheat breeding was privatized in the 1990s, so the premium varieties that are used for food have all been under total production contracts. Many find it surprising that this seemingly neglected crop one of the pioneers in adopting this model of funding breeding and seed production.

Buckwheat for food is largely the proprietary variety, Koto, released by breeder Clayton Campbell in the late 1990s. Other users largely produce Mancan, Dr. Campbell’s first release, in 1972. Some growers, based on old production guides, go looking for ‘Japanese’ or ‘Silverhull’ varieties. These have not been in commerce for five decades or more.

A contemporary role for buckwheat in field-crop production is to manage glyphosate-resistant weeds. The essential principle for herbicide-resistance management is the weeds die from many different causes. When a buckwheat crop is in the rotation, it effectively smothers a portion of the weeds. It is effective against most of weeds that have developed glyphosate resistance in New York. For these annuals, the trick is to have the weed seed germinate just a few days after the buckwheat so that they are smothered. A good buckwheat planting should show greenline by the morning of the fourth day, and outcompete the many weed seeds that germinate then. Buckwheat is also used in organic production to suppress quack grass, and prevent it from becoming a big problem.

Experienced farmers who have not raised buckwheat generally show an interest either when corn prices are low or planting season has been wet. When corn appears to be breakeven or a money loser because prices are too low, buckwheat can be profitable because the input costs are so much less. For 2016, a 120-bushel corn crop would give a ne loss of $100 per acre by my calculation, whereas the same ground planted to buckwheat would net a profit of $100. In a wet spring, buckwheat can be a catch crop on unplanted ground. The time to sow buckwheat at the beginning of July, after the opportunity to plant corn and soybeans has already passed.

Buckwheat’s low input requirements made it the mainstay on hill farms with low soil fertility and weak finances. Much of that ground is now appropriately in either forest or pasture. The farming community began to associate buckwheat with farms having the toughest time. Particularly during the Depression when buckwheat acreage was dropping elsewhere in favor of corn. In New York, that stigma persisted for decades and was still noticeable in the 1980s and 90s. The social factor likely prevented many people from trying buckwheat when it would have been a wise and profitable addition to their rotation. Some of the bigger buckwheat growers even put the crop in fields that were not visible from main roads. The stigma seems to be wearing off. Activities such as the Northeast Buckwheat Growers Association has helped bring buckwheat growers out of the shadows and bring them respect for their professionalism.

Today there is no “typical” buckwheat grower, but a few common themes emerge. A few are specialized, where buckwheat is a big part of their regular rotation and they have invested in equipment to make harvest as efficient and effective as possible. Many farmers raise a few acres of buckwheat from time to time as a catch crop on fields that could not be planted to their intended crop. Weekend farmers can start with buckwheat because it does not require day-to-day attention, the cost of basic equipment is low, and it grows satisfyingly fast even on the lower fertility fields that these farmers often own. A surprisingly large proportion of these weekend farmers are engineers who have worked at one of the Central New York’s big technology firms. Organic field crops growers use buckwheat to diversify their rotation and reduce weed pressure.

Farmers today can take pride, and profit, in raising some buckwheat as part of their rotation. Production information is available at www.hort.cornell.edu/bjorkman/lab/buck/

Print Friendly, PDF & Email

Cover crop interseeding research in New York

Brian Caldwell1, Chris Pelzer1, and Matthew Ryan1
|1
Soil and Crop Sciences Section – School of Integrated Plant Science, Cornell University

Fig. 1. Paul Stachowski drives the InterSeeder through soybeans at the Cornell Musgrave Research Farm in Aurora, NY.

The InterSeeder is a new tool developed at Penn State University that allows for drilling of cover crops into standing cash crops (Figure 1). At the same time, liquid fertilizer and herbicides can also be applied to reduce the number of tractor passes. Three 7.5”-spaced rows of cover crops are drill interseeded in the space between 30” corn or soybean rows, allowing for excellent establishment of the cover crops. This takes place after the cash crop is established and is no longer susceptible to competition from weeds (i.e., after the critical period for weed control, which is roughly stage V5 for corn and V4 for soybeans (Hall et al. 1992). Compared to being planted after cash crops are harvested in late fall, interseeded cover crops have more time to grow before winter (Figure 2). As corn and soybean begin senescing in late summer, cover crop plants quickly add biomass before winter. In proportion to their growth in the fall and the next spring, cover crops provide a number of benefits such as recycling of nitrogen in the soil, protecting soil from erosion, and adding organic matter.

Fig. 2. Interseeded red clover, crimson clover, and hairy vetch in corn.

Previous research was done in New York State using other methods of interseeding into corn (Scott et al. 1987) and soybeans (Hively and Cox 2001). See also http://mysare.sare.org/wp-content/uploads/917698final.pdf. Results were promising, but problems remained with inconsistent cover crop establishment (Jane Mt. Pleasant, personal communication). Although drilling cover crops with the InterSeeder has potential to increase consistency of establishment so that cover crop benefits are achieved, there are a number of questions about the best way to implement this practice. Optimal seeding dates, cover crop species, varieties, mixtures, and soil nutrient levels have yet to be determined. Here we report on field experiments in NYS over the past two years.

On-farm cover crop interseeding trials

In 2013 and 2014, several trials were conducted in at four on-farm sites and at the Cornell Musgrave Research Farm. Five treatments consisting of two annual ryegrass varieties, tillage radish, a legume mix (hairy vetch, red clover, and crimson clover), and ryegrass + legume mix were interseeded into corn. Roundup Ready corn was used at all locations and glyphosate was applied to control weeds prior to interseeding.

Interseeded tillage radish was grown in two trials only. It produced 100-500 dry lb/acre of biomass in the fall and was killed over the winter. Performance of annual ryegrass and mixes was variable. In general, fall cover crop dry biomass was less than 700 lb/acre. In the following spring, legumes and legume mixes often produced the most biomass. Spring biomass of winter hardy species was influenced by cover crop termination date. Overwintered cover crops in New York typically grow rapidly after May 1 until they begin to reproduce in late May to mid-June. Thus early May termination can result in much lower biomass than that of cover crops terminated in late May or early June. Biomass in the fall reflects the ability of a cover crop to reduce erosion and protect soil over the winter, whereas its biomass in the spring affects soil nutrient levels. For example, depending on management practices and weather conditions, a legume cover crop biomass of 1,000 lb/a in the spring can typically provide 15 lbs/acre of nitrogen to the following crop.

In our trials, yield of the “host” crop (a cash grain crop into which the cover crops were interseeded) was not affected by the presence of an interseeded cover crop, except in one case when the interseeding was done too late and a soybean crop was damaged by equipment. However, the host crop strongly affected the interseeded cover crop. At the Cornell Musgrave Research Farm, legumes produced over 1,500 lb/acre of biomass by May 22, 2014. In contrast, at the Reed Farm in northern New York, all cover crops produced less than 250 lb/acre of biomass by May 13, 2014. Temperatures were cooler at the Reed Farm and cover crop termination was earlier, partially explaining the lower biomass levels. In addition to climate differences, the 2013 Musgrave Farm host corn crop produced less than 100 bu/acre (due to excessive spring rain and poor drainage), whereas the Reed Farm host corn crop yielded twice as much. Cover crop growth at Musgrave Farm in spring 2014 was likely more vigorous because it established under the weaker-growing 2013 host corn. Dense, tall corn such as in the Reed Farm trial, and closed-canopy soybean stands will shade and suppress cover crops interseeded into them, especially under dry conditions.

In 2013, cover crops also performed very well at the Evanick Farm, a dairy where corn was grown for silage instead of grain. Corn was planted on May 4, 2013 and cover crops were interseeded on July 2, 2013. At this site, ‘KB Royal’ annual ryegrass produced over 2,000 lb/acre of fall biomass, sampled on October 30, 2013, and the annual ryegrass + legume mix produced 1,850 lb/acre. The next spring KB Royal, legumes, and the ryegrass/legume mixture each produced about 750 lb/acre by May 1, 2014. On dairy farms such as the Evanick Farm, manure applications may result in relatively large amounts of nitrogen mineralization after silage harvest in mid-September. This, plus the early date of corn silage removal, can allow for high cover crop biomass levels in the fall, and impressive growth in spring before an early termination. Silage yield was moderate and was not affected by the interseeded cover crops.

Comparing interseeded cover crop species in soybean

In 2013, 11 cover crop species and mixes were drill interseeded into soybeans at the Cornell Musgrave Research Farm in Aurora, New York and their performance was compared. Again, Roundup Ready soybeans were planted and glyphosate was applied for weed control prior to cover crop interseeding. Cover crops were drill interseeded into soybeans on July 16, which resulted in good establishment. Soybean yields averaged 53 bu/acre across interseeded cover crop treatments. Fall 2013 cover crop biomass, sampled after soybean harvest on November 19, 2013, was high for crimson clover, the legume mix, perennial ryegrass, cereal rye, and annual ryegrass. Red clover and tillage radish produced intermediate amounts of biomass. Orchardgrass, yellow sweet clover, ladino clover, and Kentucky bluegrass produced a low amount of fall biomass (Figure 3).

Fig. 3. Average dry matter biomass of cover crops interseeded into soybeans at the Cornell Musgrave Research Farm in Aurora NY in 2013. Cover crops were sampled in the fall of 2013 and spring of 2014. Bars represent standard error.

The following spring, several species grew well before termination on May 22, 2014. Cereal rye produced 2,000 lb/acre and medium red clover produced over 1,200 lb/acre. Yellow blossom sweet clover, perennial ryegrass, and orchardgrass also produced around 1,000 lb/acre. Annual ryegrass, Kentucky bluegrass, and ladino clover performed poorly, and winter survival of crimson clover and tillage radish was very low (Figure 3).

In the 2014-15 soybean trial, results were quite different. Weather conditions during the 2014 growing season were more challenging and cover crops were not interseeded until August 11, almost a month later than in 2013. Soybean yields were lower at 38 bu/acre, and again no differences in soybean yield were observed between treatments. Fall 2014 cover crop biomass was visibly much lower than in 2013, but cover crops were not sampled. In spring 2015, annual ryegrass produced the greatest biomass, which was similar to the amount of annual ryegrass produced in the spring of 2014. However, the other cover crop treatments did not perform as well as in the previous year (Figure 4).

Fig. 4. Average dry matter biomass of cover crops interseeded into soybean at the Cornell Musgrave Research Farm in Aurora NY in 2014. Cover crops were sampled in spring of 2015. Bars represent standard error.

Interseeding cover crops into soybeans has potential, but this practice needs more research. We observed that earlier-seeded cover crops could establish well and produce more fall and spring biomass than later-seeded cover crops, without impacting soybean yield. In both years of the experiment, red clover, orchardgrass, and the ryegrass treatments were among the top producers of biomass.

Conclusions

Interseeding cover crops into corn and soybeans can be a successful strategy to improve cover crop performance without decreasing host cash crop yields. Despite variable results, our findings indicate that: 1) interseeding cover crops too late can reduce cover crop establishment and limit biomass production; and 2) delaying cover crop termination until the second half of May can increase biomass production substantially. Interseeding cover crops in silage corn (rather than grain corn) results in better cover crop growth because corn silage is harvested earlier than corn grain, thus allowing for unobstructed cover crop growth for about an extra month in the fall.

We suggest that a reasonable interseeding program may be to establish a mixed ryegrass and legume cover crop under soybeans before next year’s corn; or ryegrass alone under corn before next year’s soybeans. Cover crops should produce a fall biomass of 200 to 500 lb/acre and protect the soil over winter. The following spring, delaying cash crop planting until late May can allow production of 2000 lb/acre cover crop biomass. Increased duration of spring cover crop growth could increase nitrogen content of biomass to 60 lb N/acre, in addition to cycling other nutrients and adding organic matter to the soil. There would likely be a minor 2nd year corn yield loss with this approach due to late planting date, but this could be offset by a reduction in corn nitrogen fertilization costs. Research is needed to better understand tradeoffs with yield potential and fertilizer costs associated with delaying cover crop termination in the spring.

The InterSeeder was designed by Bill Curran, Corey Dillon, Chris Houser, and Greg Roth at Penn State and they have developed additional guidelines and herbicide recommendations for cover crop interseeding. For more information about this practice and the InterSeeder see:

  1. http://extension.psu.edu/plants/crops/soil-management/cover-crops/interseeder-applicator/improving-the-success-of-interseeding-cover-crops-in-corn
  2. http://www.interseedertech.com/

This work was supported by a joint research and extension program funded by the Cornell University Agricultural Experiment Station (Hatch funds) and Cornell Cooperative Extension (Smith Lever funds) received from the National Institutes for Food and Agriculture (NIFA) U.S. Department of Agriculture (Project: 2013-14-425). Partial support was also provided by the Northern New York Agriculture Development Program (Project: The early interseeded cover crop gets the worm) and the USDA NRCS CIG program (Project: Maximizing conservation in the Chesapeake Bay Watershed with an innovative new 3-way interseeder for early establishment of cover crops in no-till corn and soybean). Any opinions, findings, conclusions, or recommendations expressed in this publication are those of the authors and do not necessarily reflect the view of the U.S. Department of Agriculture.

References
Hall, M.R., C.J. Swanton, and G.W. Anderson. 1992. The Critical Period of Weed Control in Grain Corn. Weed Science. 40:441-447.

Hively, W. D. and W. J. Cox. 2001. Interseeding Cover Crops into Soybean and Subsequent Corn Yields. Agron. J. 93:308–313.

Scott, T. W., J. Mt. Pleasant, R. F. Burt, and D. J. Otis. 1987. Contributions of Ground Cover, Dry Matter, and Nitrogen from Intercrops and Cover Crops in a Corn Polyculture System. Agron. J. 79:792-798.

Print Friendly, PDF & Email

Yield Component Analyses Reinforce the Idea That a Foliar Fungicide Application and Not High Plant Populations May Have Provided the Yield Increase to Soybean Under High Input Management in 2015

Bill Cox1, Eric Sandsted1, and Gary Bergstrom2
1Soil and Crop Sciences Section, 2Plant Pathology and Plant-Microbe Biology Section – School of Integrated Plant Science, Cornell University

Photo: Spraying a pesticide at the R3 stage results in mechanical damage to soybeans, especially drilled soybeans in 7.5 inch rows.

We have conducted numerous studies over the last 10 years on soybean seeding rates. In almost all instances, we rarely observed a response to rates above 150,000 seeds/acre (http://scs.cals.cornell.edu/sites/scs.cals.cornell.edu/files/shared/documents/wcu/Vol16No22006Mar-Apr.pdf; http://scs.cals.cornell.edu/sites/scs.cals.cornell.edu/files/shared/documents/wcu/WCUVol18No3_May-Jun2008-2.pdf; http://scs.cals.cornell.edu/sites/scs.cals.cornell.edu/files/shared/documents/wcu/wcu19-1.pdf; http://scs.cals.cornell.edu/sites/scs.cals.cornell.edu/files/shared/documents/wcu/WCU21-2.pdf; http://scs.cals.cornell.edu/sites/scs.cals.cornell.edu/files/shared/documents/wcu/WCU_vol22_no2.pdf). In 2015, we examined the response of soybean under high input management (~200,000 seeds/acre with a fungicide/insecticide seed treatment as well as a foliar fungicide, Priaxor, applied at 4 fluid oz. /acre on 7/31 at the R3 stage) compared with recommended input management (150,000 seeds/acre with a fungicide/insecticide seed treatment). This was part of a larger study comparing the response of all the crops in the corn-soybean-wheat/red clover rotation under conventional and organic cropping systems with recommended or high input management. We described this study in detail in a news article in the last What’s Cropping Up? issue of 2015 (https://blogs.cornell.edu/whatscroppingup/2015/11/09/soybean-yield-under-conventional-and-organic-cropping-systems-with-recommended-and-high-inputs-during-the-transition-year-to-organic/). In that article, we reported that soybean under high input management in the conventional cropping system yielded 48.6 bushels/acre, when averaged across three previous 2014 crops, compared with 44.7 bushels/acre under recommended management inputs. We did note in the previous article that despite the 9% yield increase, partial profit was not significantly different between the two treatments because the added input costs for seed and fungicide as well as the fungicide application cost offset the 3.9 bushel/acre increase for $8.50 soybeans.

Still, why did we get a yield response to high input management in the conventional cropping system? Climatic conditions were exceedingly dry from the day of fungicide application through harvest (1.4 inches of precipitation in August and 1.35 inches from September 1-20). Consequently, visually discernible disease symptoms were absent on the visible portion of soybean foliage from the R3-R8 stage. Nevertheless, because we almost never observe a response to a seeding rate of 200,000 seeds/acre compared with 150,000 seeds/acre, we speculated that perhaps the fungicide and not the higher seeding rate provided the 9% yield increase. In addition to disease control, there is some speculation that a fungicide application may improve overall soybean health, independent of disease presence.

Yield component analyses help explain why there was a yield response to high input management of soybean in the conventional cropping system in 2015. In each soybean plot (planted in 15-inch rows), we subsampled the four center rows in two 1 meter lengths (1.52 m2 area) about 5 days before the 9/23 soybean harvest of the entire plot with a plot combine. We hand-harvested all the plants in the sub-sampled area and dried them, pulled off the pods and counted them, ran the pods through a stationary thrasher, counted the seeds that were thrashed, and weighed all the seeds (~3500-4500 seeds/sample or ~7000-9000 seeds/plot).

When averaged across the three previous crops of 2014, plant populations in the sub-sampled areas a few days before harvest averaged 41.7 plants/m2 (~169,000 plants/acre) in the high input management treatment compared with 31.1 plants/m2 (126,000 plants/acre) in the recommended management treatment (Fig.1). Our sub-sampled population was slightly lower than population measurements at the V2 stage in the high input management treatment (~174,000 plants/acre, https://blogs.cornell.edu/whatscroppingup/2015/09/16/emergence-early-v2-stage-plant-populations-and-weed-densities-r4-in-soybeans-under-conventional-and-organic-cropping-systems/). In contrast, our sub-sampled population in the recommended management input treatment was slightly higher than population measurements at the V2 stage (~122,000 plants/acre). Soybean populations of the subsampled regions immediately before harvest, however, are only 2.9 to 3.2% different than at the V2 stage so we believe that our sub-sampled measurements represent the entire plot extremely well.

Fig.1 Plants/ m2 of soybean, averaged across the three previous 2014 crops, in two subsampled areas (1.52 m2) of each plot in the conventional cropping system under high management inputs (~200,000 seeds/acre with a fungicide application at the R3 stage) and recommended management inputs (~150,000 seeds/acre) at the Aurora Research Farm in 2015. Error bars represent the standard error of the means.

When averaged across the three previous crops, soybean averaged fewer pods/plant in the high input management treatment (24.5 pods/plant in high input management compared with 35.1 in recommended input management) in the conventional cropping system (Fig.2). Typically, soybeans at higher compared with lower seeding rates produce fewer pods/plant because of less intra-plant competition for light, water, and nutrients. We have seen the same degree of reduction in pods/plant at 200,000 seeds/acre compared with 150,000 seeds/acre repeatedly in previous experiments at the Aurora Research Farm (file: aj-103-1-123.pdf; file: aj-102-4-1238.pdf).

Fig.2 Pods/plant of soybean, averaged across the three previous 2014 crops, in two subsampled areas (1.52 m2) of each plot in the conventional cropping system under high management inputs (~200,000 seeds/acre with a fungicide application at the R3 stage) and recommended management inputs (~150,000 seeds/acre) at the Aurora Research Farm in 2015. Error bars represent the standard error of the means.

When averaged across the three previous crops, soybean averaged more seeds/pod in the high input management treatment (2.23 seeds/pods compared with 2.09 seeds/pod in recommended input management) in the conventional cropping system (Fig.3). Furthermore, soybean averaged greater seed weight in the high input management treatment (150.4 mg compared with 144.3 mg in the recommended input management treatment) in the conventional cropping system (Fig.4). In the two previously cited studies, we did not see a seeding rate effect on seeds/pod or seed weight, which is consistent with other studies in the USA. Despite virtually zero disease pressure in 2015 because of the very dry August and first half of September conditions, could the fungicide application have resulted in more seeds/pod and seed weight because of improved plant health? Certainly an increase in seeds/pod and seed weight are the two yield components most likely to be affected by a fungicide application at the R3 stage. We did not, however, observe delayed senescence in the high input management compared with the recommended input management treatment. (It is possible that the higher plant populations offset a potential fungicide effect on delayed senescence.)

Fig.3 Seeds/pod of soybean, averaged across the three previous 2014 crops, in two subsampled areas (1.52 m2) of each plot in the conventional cropping system under high management inputs (~200,000 seeds/acre with a fungicide application at the R3 stage) and recommended management inputs (~150,000 seeds/acre) at the Aurora Research Farm in 2015. Error bars represent the standard error of the means.
Fig.4 Seed weight of soybean, averaged across the three previous 2014 crops, in two subsampled areas (1.52 m2) of each plot in the conventional cropping system under high management inputs (~200,000 seeds/acre with a fungicide application at the R3 stage) and recommended management inputs (~150,000 seeds/acre) at the Aurora Research Farm in 2015. Error bars represent the standard error of the means.

If you multiply out the yield components (plants/m2 x pods/plant x seeds/pods x seed weight), the sub-sample yields averaged 51.1 bushels/acre in the high input management compared with 49.0 bushels/acre in the recommended input management treatments. The sub-sample yields were ~5-10% greater than the actual plot yields, and the difference in yield between treatments was only 4.3% instead of the 9% difference in plot yields. Nevertheless, we feel that the sub-sampled data provide us with insight on how soybean responded to high input management (fewer pods/plant with higher seeding rates and more seeds/pod and seed weight perhaps because of the fungicide application?).

Conclusions:
We will continue this study for two additional years to see if there is indeed a response to fungicide application in the presence of high seeding rates. Currently, it is pure speculation that a fungicide application at the R3 stage resulted in more seeds/pod and greater seed weight in soybean. Nevertheless, an increase in seeds/pod and seed weight would be the two most likely yield components that an R3 fungicide application would affect. As noted previously, the 9% yield advantage did not result in an increase in partial profit. Furthermore, we avoided the harvest rows when applying the fungicide application at the R3 stage. In a production field, an R3 fungicide application would probably result in some yield reduction, associated with mechanical damage of the crop, especially with spray booms less than 90-120 feet in width, reducing the magnitude of the potential yield response. We are looking forward to 2 more years of research on this topic.

Print Friendly, PDF & Email

What’s Cropping Up? Volume 25: Number 5 – November/December

Comparing Static and Adaptive Nitrogen Rate Tools for Corn Production

Lindsay Fennell1, Shai Sela1, Aaron Ristow1, Harold van Es1, Shannon Gomes2
1Soil and Crop Sciences Section, School of Integrative Plant Science, Cornell University; 2Cedar Basin Crop Consulting

Determining the optimum nitrogen rate for corn production has been an elusive goal for many years, despite its economic significance to farmers and the concerns about environmental impacts. Several tools are available to provide nitrogen rate recommendations for corn growers, and many producers and retailers often wonder how these different recommendation systems compare. These approaches can be categorized as (i) static and (ii) adaptive. Static tools offer generalized recommendations that do not consider seasonal conditions of weather and soil/crop management, while adaptive approaches account for the variable and site-specific nature of soil N dynamics. Using strip trial data from four years of research on commercial farms we compare the recommendations from conventional static approaches in New York (Cornell Nutrient Calculator; CNC) and Iowa (Maximum Return to Nitrogen; MRTN) with the adaptive Adapt-N approach to explore the differences in recommended rates. The strip trials involved only Grower rates vs. Adapt-N rates as treatments, and we consequently cannot make direct conclusions on yield and profitability relative to CNC and MRTN. Therefore, in this article we focus on simply comparing the N rate recommendations from the three different tools.

The Tools

Cornell Nutrient Calculator: The Cornell Nutrient Calculator is a static approach that includes a basic mass balance calculation of N demand (yield-driven crop uptake) and N supply (soil organic matter, manure, previous crops, etc.), combined with efficiency factors. The CNC estimates can be derived from a spreadsheet downloaded from http://nmsp.cals.cornell.edu/software/calculators.html. The CNC nitrogen recommendation for corn is calculated as follows (Ketterings et al., 2003):
Vanes Equation 1


Where NRequired is the total amount of N (lbs N/acre) from any source required for optimum crop production. YPcorngrain is the yield potential of corn grain in bushels (85% dry matter) per acre. Nsoil and Nsod are the amounts of N (lbs N/acre) expected to be released from mineralization of soil organic matter and a plowed-down sod, respectively, and feff is a nitrogen uptake efficiency factor that depends on soil type and drainage. YPcorngrain, Nsoil, and feff are available from tabular values based on soil type that are incorporated into the spreadsheet. YPcorngrain can also be entered as a default value or based on field yield history. Manure contributions from up to three years past can be incorporated into the recommendations.

MRTN: The Maximum Return to N (MRTN) method is also a static approach which is based on the average economically optimum nitrogen rate (EONR) from multi-site and multi-year field trial data and is promoted in most Midwestern US states (Sawyer et al., 2006). In Iowa, MRTN recommendations are highly generalized into a single state-wide recommendation for either corn-after-corn or corn-after-soybean with adjustments only for the relative prices for grain and fertilizer. However, Deen et al. (2015) found that variations in seasonal weather were three times more impactful on EONR than price ratio fluctuations. MRTN recommendations can be determined using an online calculator (http://extension.agron.iastate.edu/soilfertility/nrate.aspx).

Adapt-N: The Adapt-N tool employs simulation models and biophysical data to combine soil, crop and management information with near-real-time weather data to estimate optimum N application rates for corn. Although it was developed at Cornell University it has recently been licensed for commercial use (adapt-N.com). It is currently calibrated for use on about 95% of the US corn production area and is flexible in terms of nutrient management options with inputs for applications of fertilizer or manure from different sources (dairy, swine, poultry), or rotation crops (sod, soybean, etc.). One of the key user inputs is the site-specific attainable yield, based on long-term yield records.

Adapt-N generates adaptive N recommendations based on a dynamic mass balance approach according to the following equation:
Vanes Equation 2


Where Nrec is the N rate recommendation; Nexp_yld is the crop N content needed to achieve the expected yield. The expected yield is based on producer provided historic field data; Ncrop_now and Nsoil_now are the N content in the crop and soil as calculated by the model for the current simulation date; Nfut_gain-loss is a probabilistic estimate of future N gains minus losses until the end of the growing season, based on model simulations with historical rainfall distribution functions; and Nprofit_risk is an economic adjustment factor that integrates corrections for fertilizerand grain prices, as well as the relative profit risk of under-fertilization vs. over-fertilization.

Adapt-N vs. Cornell N Calculator and MRTN rates

Adapt-N was used in 115 paired field strip trials with three or four nitrogen fertilizer replications conducted mostly on commercial farms (two university research farms were involved) in New York and Iowa during the 2011-through-2014 growing seasons (cf. Fennell et al., 2015; this issue). Although the experimental design of the study compares N rates for Adapt-N and Grower-selected treatments (which represented conventional practices), we also had an opportunity to compare the adaptive approach of the Adapt-N tool to the respective rates recommended by the CNC and the MRTN methods. Note: Each growing season did not necessarily involve the same fields and management practices, like manure application. The pre-plant or starter fertilizer rates varied and averaged 76 and 56 lbs/ac for the NY and IA trials, respectively.

The CNC estimate included two rates: (i) based on the default yield potentials in the CNC software (which were universally much lower) and (ii) based on expected yield values for the field supplied by the grower, i.e. “realistic” field-specific expected yield. N credits from manure application were directly accounted for in the CNC software.

For the MRTN approach, the rate was adjusted to account for manure credits calculated using the Iowa State University manure management guidelines (PM-1811), which assumes N use efficiency of 100% and 35% for swine and dairy manure, respectively. If the sum of the calculated credits for a trial exceeded the MRTN rate, a zero MRTN rate was assigned.

Results

In contrast to the static N recommendation approach, Adapt-N recommended N rates varied substantially from field to field and among growing seasons (Table 1 and 2). Since the strip trials involved an Adapt-N and a Grower-selected rate, they allow us to make conclusions on the performance of these two approaches.   In short, results showed that in 83% of all 115 strip trials, Adapt-N recommended a lower N application than the respective Grower-defined rate and these reduced rates resulted in an increased profit in 73% of trials, with an average increase of $29/ac over the Grower rate (Sela et al., in review; Moebius-Clune et al., 2014).

Vanes Corn Production Table 1 Vanes Corn Production Table 2

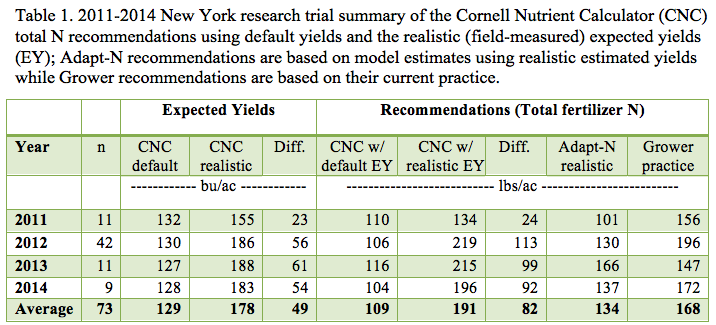
CNC vs. Adapt-N: The CNC method accounts for several variables, including past manure applications and soil types, which, as previously mentioned, are reflected in a different rate for each trial. One issue with the current CNC approach is the selection option for the yield potential (YP), based either on default values or “realistic” yield estimates from historic field-measurements. The CNC default expected yields were on average 49 bu/ac lower than the realistic expected yields (Table 1). Incidentally, New York grower-estimated realistic yields averaged 178 bu/ac, which was generally close to the actual achieved yields at the end of the season, 173 bu/ac on average. The resulting CNC N rate recommendations were highly sensitive to these yield estimates: rates based on realistic yields averaged 82 lbs/ac higher than those based on the default expected yields (191 and 109 lbs/ac, respectively).

Vanes Corn Production Figure 1Adapt-N recommended rates fell in between those extremes at 134 lbs/ac. (Table 1, Fig. 1a). I.e., the CNC rates calculated using the realistic estimated yields were on average 57 lbs/ac higher than the Adapt-N rates. Based on the results of the comparison of Adapt-N with Grower-selected rates (which were generally excessive but still 23 lbs/ac lower than the CNC rates with realistic yields; Table 1), we infer that the CNC recommendations with realistic expected yields are generally too high. Conversely, using the less-realistic default yields appears to result in overall better N rate recommendations, but still too low in wetter seasons (esp. 2013).

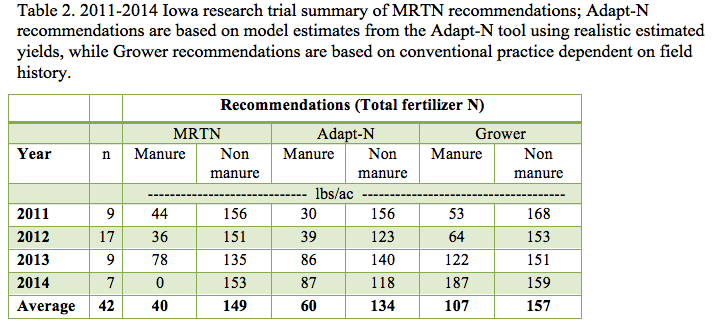
MRTN vs. Adapt-N: The MRTN rates for the Iowa trials were fixed at 188 lbs/ac and 133 lbs/ac for corn-after-corn and corn-after soybean rotations, respectively for the non-manured sites (Fig 1b), while the Adapt-N rates showed a wide range from about 40 to 220 lbs/ac, primarily depending on soil type, organic matter contents and weather conditions. On average the Adapt-N rates for non-manured sites were 15 lbs/ac lower than the respective MRTN rates (134 vs.149 lbs/ac; Table 2).

The Iowa manured sites showed a wide range of fertilizer recommendations for both Adapt-N and MRTN (Fig 1b). On average, the recommended fertilizer rates for Adapt-N were 20 lbs/ac higher than MRTN, with differences especially pronounced in cases involving fall swine manure applications where the Iowa State University calculations assume 100% N contribution for the following growing season, often resulting in very low N fertilizer recommendations. The Grower practice averaged higher than both the MRTN rates and Adapt-N rates, especially for manured fields (67 and 47 lbs/ac higher than MRTN and Adapt-N, respectively). In all, MRTN rates are similar on average to Adapt-N rates, but the former is lower with manure applications and higher without manure. Adapt-N rates varied more based on location-specific conditions.

Conclusions

The static N recommendation tools are more generalized compared to adaptive tools like Adapt-N, and do not allow for precision N management specific to each production environment (field, season, management). The 115 strip trials offered an opportunity to make comparisons of Adapt-N with Cornell N Calculator (New York) and MRTN (Iowa) N rate recommendations under real-farm conditions, but did not enable direct analysis of their relative yield and profitability performance.

We conclude that the main issue with the CNC recommendations is the large discrepancy between the N recommendations using the default yield potentials and those based on realistic yield potentials. When using the latter, the yield expectations are more correct but the recommended rates are much higher than the Adapt-N rates and appear to be excessive in most cases. Conversely, recommendations based on default yields average below Adapt-N rates and appear to be too conservative in wetter years. The default yield values appear to be about 40-50 bu/ac below current yields, which have in recent decades increased due to improved crop genetics and management. Updating the default yield values appears logical, but would result in excessive N recommendations in most years.

MRTN recommended rates were on average similar to Adapt-N rates, but they were lower with manure applications and higher without manure. In the non-manure cases, MRTN rates were principally higher in some years (2012; 2014). Adapt-N rates varied more based on location-specific conditions, which is important for preventing excesses and deficiencies and reducing environmental impacts.

In all, we conclude that on average the static (CNC and MRTN) and adaptive (Adapt-N) approaches resulted in similar N rate recommendations, but they vary considerably depending on growing season weather, soils, management practices and yield assumptions.

Acknowledgements

This work was supported by funding from the USDA-NRCS Conservation Innovation Program grant number 1258410, New York Farm Viability Institute, USDA-NIFA WQ grant number 1258250, the Northern New York Agricultural Development Program, USDA-Sustainable Agriculture Research and Extension grant number 1258396, the International Plant Nutrition Institute, and the McKnight Foundation. We are grateful for the cooperation in field activities from Keith Severson, Sandra Menasha, Anita Deming, and Michael Davis of Cornell Cooperative Extension, David DeGolyer, Dave Shearing and Jason Post of Western NY Crop Management Association, Eric Bever and Mike Contessa at Champlain Valley Agronomics, Eric Young at Miner Institute, Peg Cook of Cook’s Consulting, and Hal Tucker, Michael McNeil, and Frank Moore of MGT Envirotec. We also are thankful for the cooperation of the many farmers who implemented these trials on their farms.

References

Deen, B., K. Janovicek, J. Lauzon, and T. Bruulsema. 2015. Optimal rates for corn nitrogen depend more on weather than price. Better Crop. with Plant Food 99(2): 16–18.

Fennell, L., S. Sela, A. Ristow, B. Moebius-Clune, D. Moebius-Clune, R. Schindelbeck, and H. van Es. 2015. Adapt-N Recommendations Reduce Environmental Losses. What’s Cropping Up? 25: (this issue).

Ketterings, Q.M., S.. Klausner, and K.J. Czymmek. 2003. Nitrogen guidelines for field crops in New York. CSS Extension Series E03-16. Cornell University, Department of Crop and Soil Sciences, Ithaca NY. 70 pp.

Moebius-Clune, B., M. Ball, H. van Es, and J. Melkonian. 2014. Adapt-N Boosts Profits and Cuts N Losses in Three Years of On-Farm Trials in New York and Iowa. What’s Cropping Up? 24:57-60.

Sawyer, J., E. Nafziger, R. G., L. Bundy, G. Rehm, and B. Joern. 2006. Concepts and rationale for regional nitrogen guidelines for corn. PM 2015. Iowa State Univ. Ext., Ames, IA.

Sela., H.M. van Es, B.N. Moebius-Clune, R. Marjerison, J.J. Melkonian, D. Moebius-Clune, R. Schindelbeck, and S. Gomes, Adapt-N Recommendations for Maize Nitrogen Management Increase Grower Profits and Reduce Environmental Losses on Northeast and Midwest USA Farms, Submitted to the Soil Science Society of America Journal.

van Es, H.M., B.D. Kay, J.J. Melkonian, and J.M. Sogbedji. 2007. Nitrogen Management Under Maize in Humid Regions: Case for a Dynamic Approach. p. 6–13. In Bruulsema, T. (ed.), Managing Crop Nutrition for Weather. International Plant Nutrition Institute.

Print Friendly, PDF & Email

What’s Cropping Up? – Vol. 25, No. 3 – Full Version