
Quirine Ketterings1, Karl Czymmek1,2, Sanjay Gami1, Mike Reuter3, and Mike Rutzke4
1Cornell University Nutrient Management Spear Program, 2PRODAIRY, 3Dairy One, and 4Cornell Nutrient Analysis Laboratory
Introduction
The corn stalk nitrate test (CSNT) is an end-of-season evaluation tool for nitrogen (N) management for 2nd or higher year corn fields. The greatest benefit of this test is that it allows for evaluation and fine-tuning of N management for individual fields over time. Corn stalk nitrate test results >2000 ppm indicate that more N was available during the growing season than the crop needed.
Findings 2010-2016
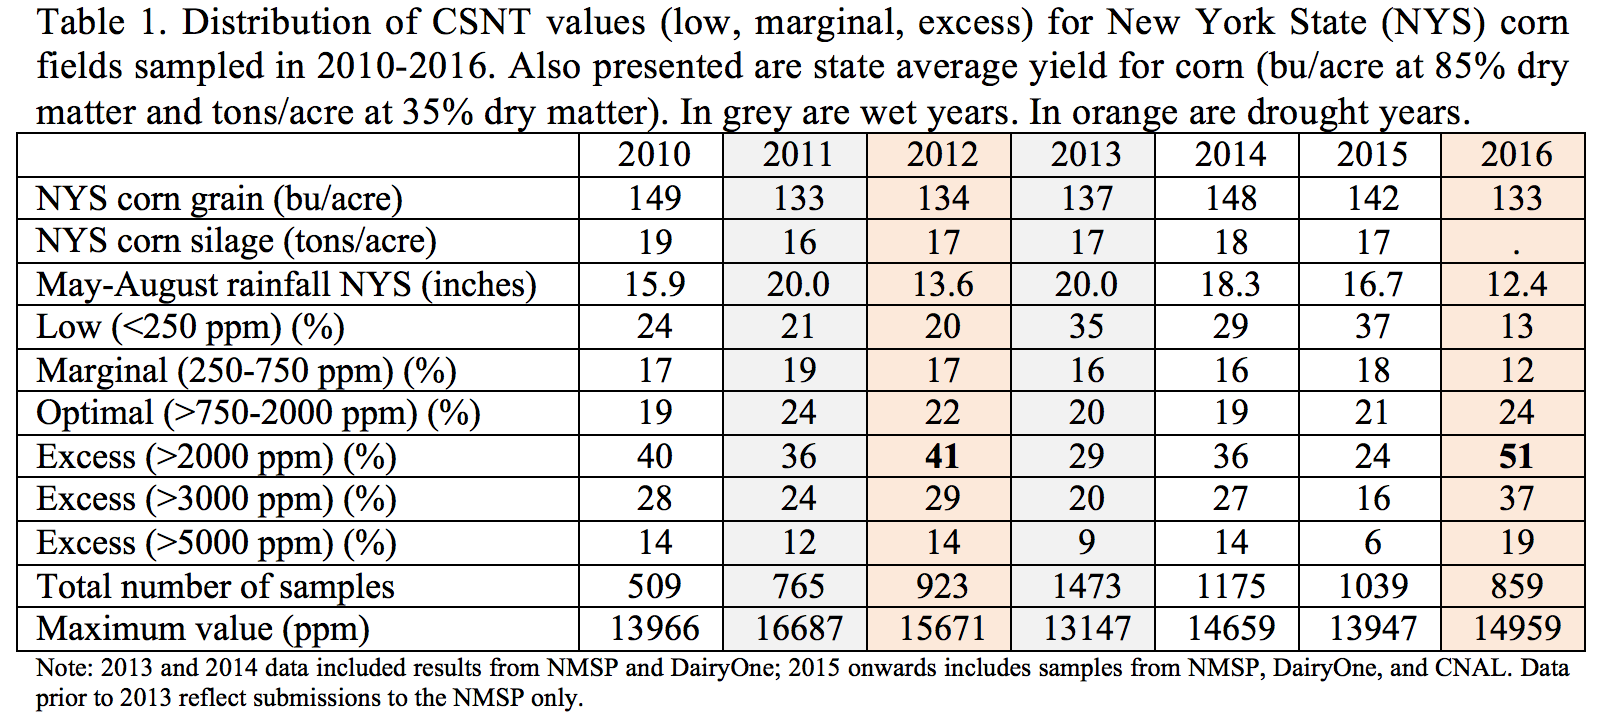
The summary of CSNT results for the past seven years is shown in Table 1. For 2016, 51% of all tested fields had CSNTs greater than 2000 ppm, while 37% were over 3000 ppm and 19% exceeded 5000 ppm. In contrast, 13% of the 2016 samples tested low in CSNT.
Crop history, manure history, other N inputs, soil type, and growing conditions all impact CSNT results, and crop management records that include these pieces of information can be used to evaluate CSNT results and determine where changes can be made. Weed pressure, disease pressure, lack of moisture in the root zone in drought years, lack of oxygen in the root zone due to excessive rain (anaerobic soil conditions), and other stress factors can impact the N status of the crop as well, so in some circumstances, additional N might not have been able to overcome the real reason for the low CSNTs (e.g. no amount of N fertilizer can make up for a drought).
The 2016 data are consistent with 2012, another drought year with just 13.6 inches of rainfall between May and August. Large percentages of excessive CSNTs (36-40%) are also observed during very good growing seasons (2010, 2014) possibly due to a greater N supply by soils when growing conditions are good (moisture and heat).
These data point out the need to evaluate CSNT result in light of not just manure and fertilizer N management but also in light of the weather patterns that year. It does, also show the need for multiple years of testing to gain experience with on-farm interpretation. In addition, within-field spatial variability can be considerable in New York, requiring (1) high density sampling (1 stalk per acre at a minimum) for accurate assessment of whole fields, or (2) targeted sampling based on yield zones, elevations, or soil management units. It is recommended to gather at least two years of data before making any management changes unless CSNT’s exceed 5000 ppm (in which case one year of data is sufficient).

Relevant References
- Instructions for CSNT Sampling; Cornell Nutrient Management Spear Program: http://nmsp.cals.cornell.edu/projects/nitrogenforcorn/StalkNtest.pdf
- Agronomy Factsheet #31: Corn Stalk Nitrate Test (CSNT) (http://nmsp.cals.cornell.edu/publications/factsheets/factsheet31.pdf).
- Agronomy Factsheet 63: Fine-Tuning Nitrogen Management for Corn (http://nmsp.cals.cornell.edu/publications/factsheets/factsheet63.pdf)
- Agronomy Factsheet 72: Taking a Corn Stalk Nitrate Test Sample after Corn Silage Harvest. (http://nmsp.cals.cornell.edu/publications/factsheets/factsheet72.pdf)
Acknowledgments
 The thank the many farmers and farm consultants that sampled their fields for CSNT. For questions about these results contact Quirine M. Ketterings at 607-255-3061 or qmk2@cornell.edu, and/or visit the Cornell Nutrient Management Spear Program website at: http://nmsp.cals.cornell.edu/.
