
Aaron Ristow1, S. Sela1, H. van Es1, R. Marjerison1, J. Melkonian1, R. Schindelbeck1, D. DeGolyer2, K. Severson3, E. Young4, Lindsay Fennell1
1Soil and Crop Sciences Section, School of Integrative Plant Science – Cornell University, Ithaca, NY
2Western New York Crop Management Association, Warsaw, NY
3Cornell Cooperative Extension, Auburn, NY
4W.H. Miner Institute, Chazy, NY
Nitrogen (N) management is important in corn production systems because of the high cost of N fertilization and public concerns over environmental impacts. Corn response to N is highly variable, so determining the optimum N rate is challenging. The economically optimal N rate (EONR) can often range from 0 to as much as 250 lb/acre for a field depending on many soil and management factors, as well as the weather. This variability leads to uncertainty which often results in excessive application of N fertilizer to reduce yield risks, thus adding unnecessary fertilizer costs and increasing the potential for environmental losses.
Several tools are available for growers to determine optimal fertilizer N requirements. These approaches can be categorized as either static or dynamic. Static tools offer generalized recommendations that do not consider seasonal conditions of weather and variation in crop management, while dynamic approaches account for the variable and site-specific nature of soil N dynamics.
This study focuses on two New York nitrogen recommendation tools: the dynamic Adapt-N simulation model and the static Cornell Corn Nitrogen Calculator. We evaluated whether accounting for weather effects and site-specific conditions improves N recommendation rates. The study had two objectives:
a) To compare the N recommendations of the Cornell Corn Nitrogen Calculator and the Adapt-N tools relative to the optimum rate, and
b) To compare the environmental losses resulting from these recommended N rates.
Methods
The Corn N Calculator
The Cornell University Corn Nitrogen Calculator (CNC) is a static approach that includes a calculation of N demand (yield-driven crop uptake) and N supply (soil organic matter, manure, previous crops), combined with efficiency factors. The CNC has been the conventional approach to corn N rate calculations in New York for several decades and estimates can be derived from a spreadsheet downloaded from http://nmsp.cals.cornell.edu/software/calculators.html.
The CNC tool allows the use of either a default yield potential from an embedded database, or a manually entered value for yield potential entered by the user. The CNC default yield potential depends on field soil type and drainage status. For this analysis we generated N recommendations using both the default yield potential and a manually entered realistic yield potential based on grower-estimates from historical yield performance.
The Adapt-N tool
Adapt-N (Adapt-N.com) is a web-based dynamic simulation tool that combines soil, crop and management information with near real-time high resolution weather data to estimate optimum N application rates for corn. It is intended primarily as an in-season tool to provide recommendations for sidedressing. To generate N recommendations, the tool requires user inputs such as achievable yield, soil texture class or soil series name, organic matter content, crop variety, information on previous crops, manure or pre-plant N applications (if applicable), and the field tillage practice. Combining this information with early season weather data was expected to improve the precision of N recommendations and thus maximize farm profits while minimizing environmental N losses.
Data from 16 replicated field trials from multiple locations in New York between 2011 and 2015 were used to compare the sidedress N recommendations generated by the CNC and Adapt-N tools. The CNC tool generates a total N recommendation for the field conditions regardless of the timing of the N application. Therefore, in the case of the CNC tool, if the grower in the experiment opted to apply some of the N rate as a starter or pre-plant, this rate was subtracted from the total N recommendation and the rest was used as sidedress. For the case of Adapt-N, these early applied N rates were included in the simulations used to generate the sidedress recommendations.
Field data
In each of the field trials, multiple N rate applications were used, allowing the EONR of each trial to be calculated using quadratic function curve fitting. The economic losses from the EONR resulting from the CNC and the Adapt-N rates were calculated based on a price of $0.50 per lb of N fertilizer and $4.95 per bushel of corn. It should be emphasized that the EONR represents the optimum nitrogen rate that is determined at the end of the growing season. It is therefore a reference point made in hindsight for evaluation of N recommendation tools that are used early in the season when fertilizer needs to be applied.
Estimation of environmental losses
Leaching losses from the bottom of the root zone and gaseous losses to the atmosphere due to denitrification and ammonia volatilization were simulated by the Adapt-N tool. The trials used for the analysis had different N management approaches, depending on collaborator preferences, such as pre-plant N or manure applications in different quantities. While these management decisions might have led to high simulated N losses prior to sidedress time, these losses would have been the same for the Adapt-N and the CNC tools. Therefore, to compare the simulated environmental losses resulting from the Adapt-N or the CNC sidedress recommendations, only the environmental fluxes that occurred after the application of sidedress N and until the end of the year (Dec 31st) are reported.
Results and discussion
Potential yields and N recommendations

Figure 1 presents a CNC comparison between the default potential yields derived for each field and the realistic estimated yields supplied by the grower (Note: the 1:1 line indicates equal values, and data points below the line indicate lower values for the variable on the Y-axis, and vice versa). The potential yields supplied by the CNC tool were significantly lower (130 bu/ac) than the grower estimates (192 bu/ac), which were generally close to the actual achieved yields recorded at the end of the season (189 bu/ac). This indicates that growers generally have a good sense of a field’s yield potential and that the default potential yields in the CNC tool are well below the actual yields.
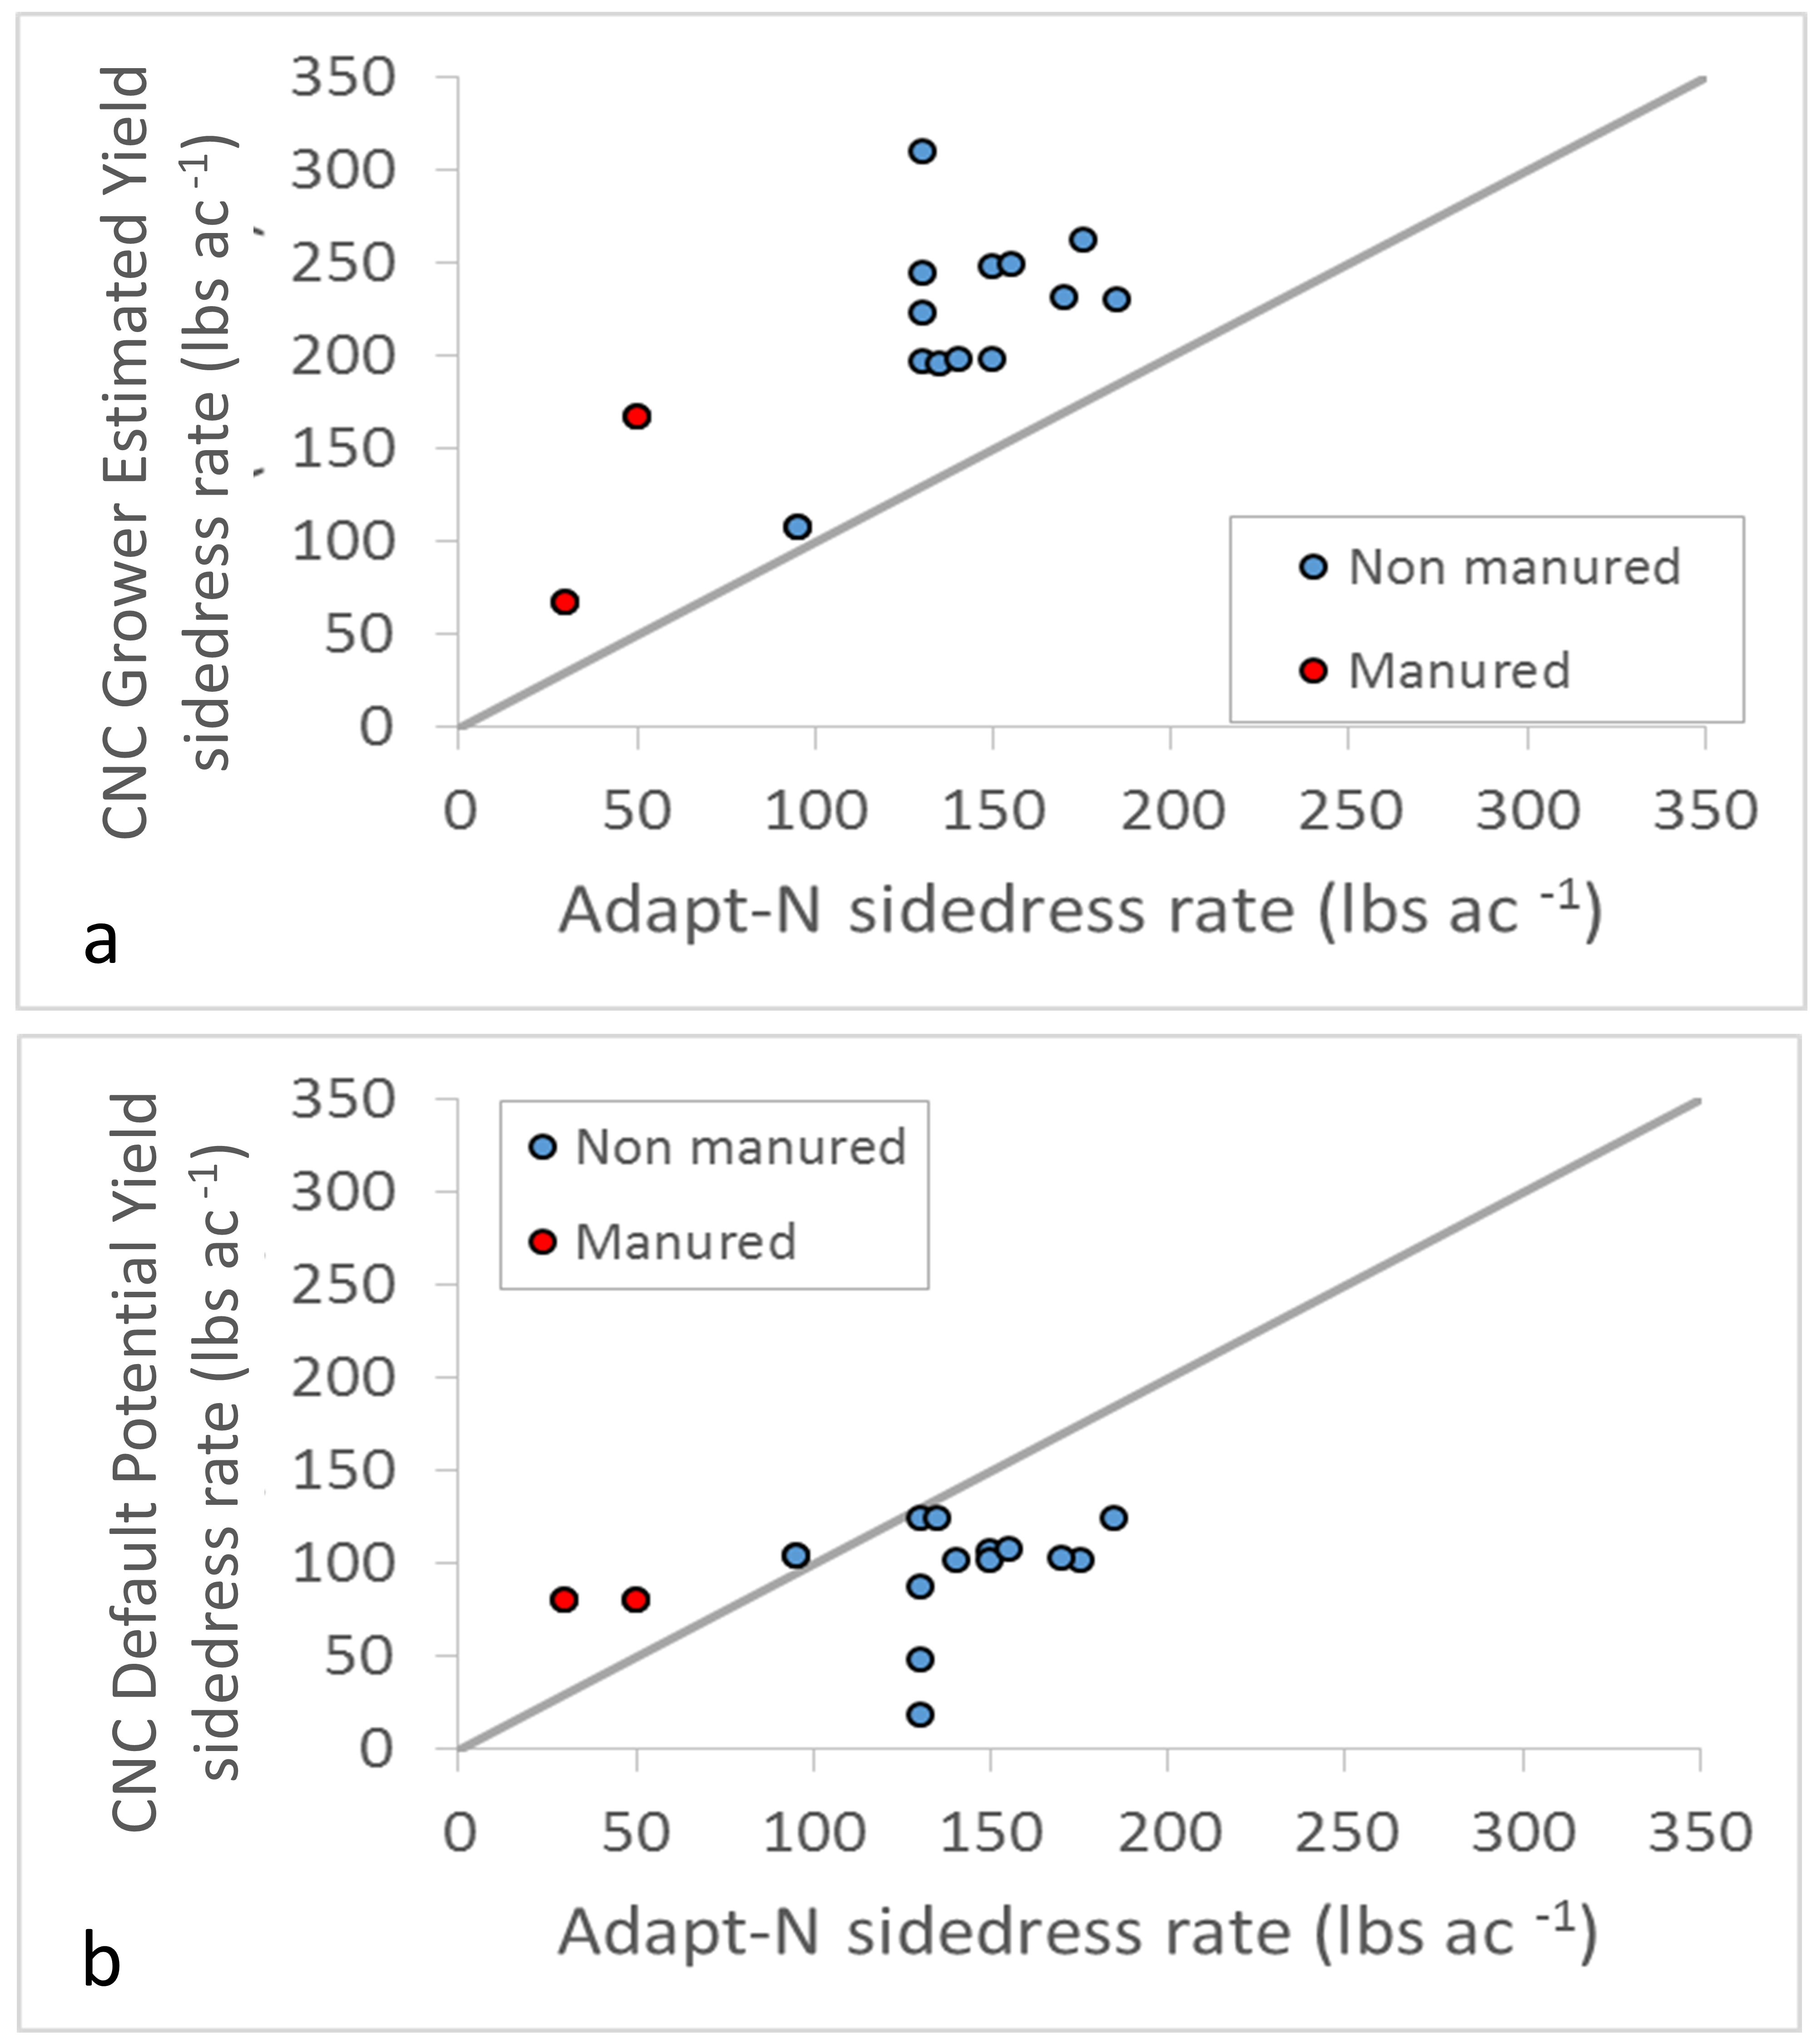
Choosing between Grower-estimated and default potential yield was found to have a strong effect on the N rates recommended by the CNC, especially comparing both to the Adapt-N rate. Using the realistic, grower-estimated potential yield (Figure 2a), the CNC recommended on average 213 lb N/ac for non-manured trials and 117 lb N/ac for manured trials. The average recommendation rate for Adapt-N, which is driven by the grower-estimated potential yield, was 141 lb N/ac and 40 lb N/ac for the non-manured and manured trials, respectively, a substantial decrease of 72 lb N/ac (51%) and 77 lb N/ac (65%) from the CNC rate.
Using the default potential yield (Figure 2b), the CNC recommended on average 97 lb N/ac for the non-manured trials, a 44 lb N/ac (31%) decrease over the respective Adapt-N rate. For the manured trials the CNC tool recommendation remained higher than Adapt-N’s recommendation, with an 80 lb N/ac (100% increase). However, as the CNC sidedress N recommendations result from a possibly outdated potential yield, these rates could be insufficient in fulfilling the actual crop needs, despite the higher recommendation.
Economic analysis
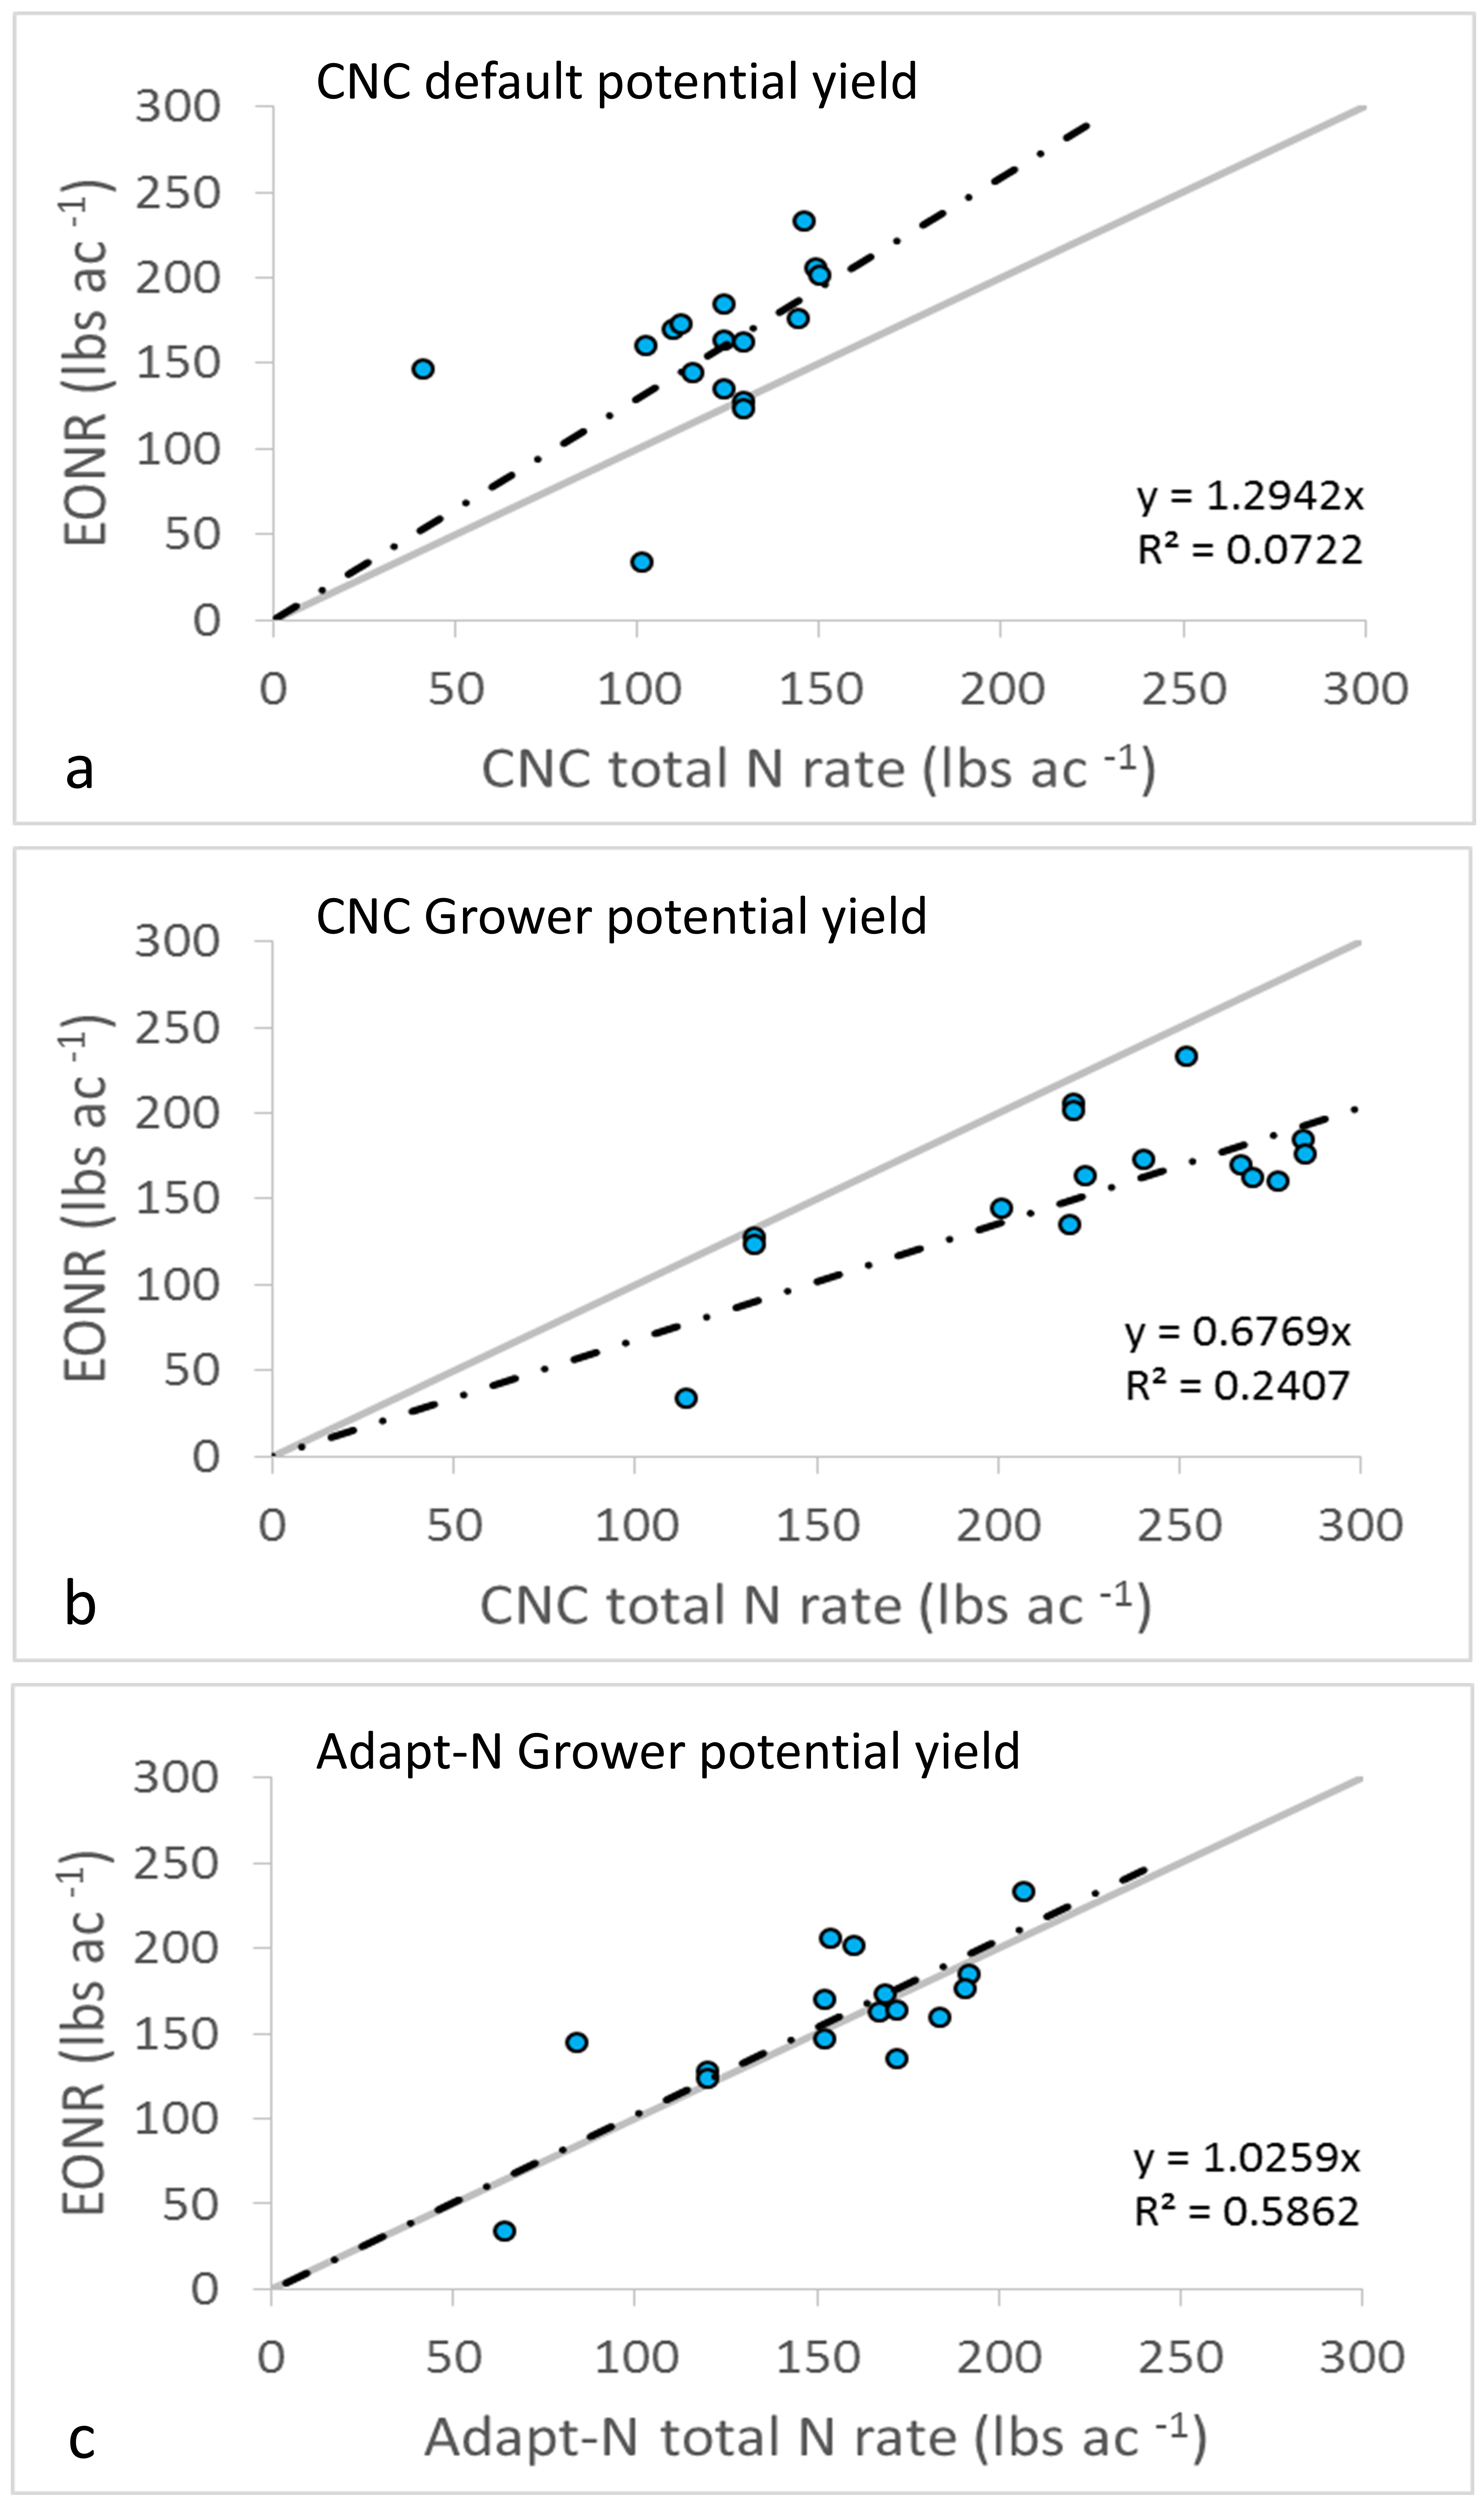
The CNC tool with the default potential yield considerably under-estimated the optimum N rate calculated from the quadratic function response curve, with an average rate of 120 lb N/ac compared with 159 lb N/ac for the EONR (Figure 3a). The lower recommendations lead to an average profit loss from the EONR of $44/ac. Conversely, when the CNC tool was supplied with a more realistic grower-estimated potential yield, the CNC recommendations were found to substantially overestimate the optimum rate, with an average of 229 lb N/ac, or 70 lb N/ac above the EONR (Figure 3b), leading to an average profit loss from the EONR of $38/ac.
Figure 3c presents the relation between the Adapt-N rates and the EONR, and shows that it accurately predicted the EONR with an average N rate of 153 lb N/ac, only slightly below the 159 lb N/ac calculated average value of the EONR. Consequently, the average loss from the EONR was $9/ac for Adapt-N, a significant improvement over the losses from the CNC rates. By basing recommendations on local conditions, Adapt-N improved the accuracy and precision of the N recommendations in these trials.
Environmental N losses

Simulated environmental losses that occurred following the application of the CNC and Adapt-N sidedress rates were divided almost evenly between leaching and gaseous losses for either tool (Figure 4), which reflects the medium texture of the soil at most sites.
Adapt-N rates reduced on average 26 lb N/ac of leaching losses (Figure 4a, 53% reduction) and 21 lb N/ac of gaseous losses (Figure 4b, 54% reduction) compared to the CNC rates with realistic (Grower-estimated) yields. Conversely, when potential yields were derived from the CNC database, the lower CNC N recommendations only marginally reduced the environmental losses compared to the Adapt-N based recommendations (Figure 4a and b, 8 lb/acre, on average).
The relation between total environmental N losses occurring post sidedress and the sidedress rate showed an exponential relationship between application amount and the simulated N losses (Figure 4c). This demonstrates that the relative amount of N lost to the environment is much larger when excessive N rates are applied. Apparently, under-fertilization does not accrue substantial environmental gains while reducing farmer profitability, while over-fertilization increases environmental losses without gaining profitability advantages. The Adapt-N tool was close to the EONR and mostly achieved both objectives.
Conclusions
This study presents a comparison between two N recommendation tools for corn nutrient management: CNC, which uses a static approach, and Adapt-N, which employs a fully dynamic simulation-based approach. Adapt-N recommendations were found to better account for the different production environments and weather effects, and were therefore superior to those of the CNC in terms of profitability and reconstructing the experimental EONR under the different management scenarios. The CNC default potential yield estimates were found to be unrealistically low compared with both the grower-estimated potential yields and the actual achieved yields in the experimental sites. However, using the CNC tool with more realistic grower-estimated yield estimates resulted in a substantial overestimation of the EONR and increased environmental losses. Our results suggest that adoption of a dynamic N recommendation tool in New York can significantly increase farmers’ profits while reducing environmental N losses.
A full manuscript of this article titled “Dynamic model improves agronomic and environmental outcomes for Corn N management over static approach” is currently under review by the Journal of Environmental Quality.
