
Bill Cox and Eric Sandsted
Soil and Crop Sciences Section – School of Integrated Plant Science, Cornell University

It has been documented that current commercial corn hybrids require greater seeding and N rates to maximize grain yield compared with hybrids released in the 1990s, or even in the early to mid-2000s. Seeding rates are frequently based on yield goal, so optimum seeding rates are ~38,500 kernels/acre for high-yielding current hybrids (>250 bushels/acre) under growing conditions in the Midwest USA. Consequently, an increasing number of grain growers in the Midwest are planting at seeding rates greater than 35,000 kernels/acre. In NY, our yield goal is lower but an increasing number of growers who average 190-220 bushels/acre on their farm are planting corn at ~35,000 kernels/acre, greater than our recommended ~30,000 kernels/acre. In addition, there is a general perception that in order to maximize yield from these high-yielding hybrids, higher N rates are also required, despite the greater N use efficiency of current hybrids. We decided to once again examine the response of corn to higher than recommended seeding rates (~35,500 vs. ~29,600 kernels/acre, respectively) and N rates (185 vs.145 total N lbs/acre, respectively when corn followed corn or a small grain, and 145 vs. 105 total lbs N/acre when following soybean). This was part of a larger study comparing the response of all the crops in the corn-soybean-wheat/clover rotation under conventional and organic cropping systems with recommended or high input management, described in detail in the last What’s Cropping Up? issue of 2015. In that article, we reported that corn under high input management in the conventional cropping system averaged 167 bushels/acre across three previous crops compared with 163 bushels/acre under recommended management inputs. (https://blogs.cornell.edu/whatscroppingup/2015/11/09/corn-yield-under-conventional-and-organic-cropping-systems-with-recommended-and-high-inputs-during-the-transition-year-to-organic/).
The 2015 results agreed with research that we conducted a few years ago. If you recall, we tested two hybrids (DKC51-86 and P0125XR) in 2010 and 2011, and reported that in both years, including the high yielding year of 2010 (~300 bushels/acre), recommended seeding rates (30,000 kernels/acre) and N rates (~125 lbs total N /acre following soybean) resulted in similar yields to seeding rates of 35,000 and 40,000 kernels/acre with ~175 lbs total N/acre (http://scs.cals.cornell.edu/sites/scs.cals.cornell.edu/files/shared/documents/wcu/WCUVol22No.pdf). So why once again was there no response to high input management of corn in 2015? Yield component analysis and plant N status under the 2015 growing conditions may shed some light on the lack of response.

We side-dressed corn in the conventional management system at the V6 stage on June 26, somewhat later than normal because of the excessively wet June conditions at the Aurora Research Farm (8.00 inches of precipitation in June). Two days after side-dressing (6/28), we received 1.75 inches of precipitation, resulting in extremely wet soil conditions. The study was conducted on a Honeoye silt loam soil with tile drainage so there was very little ponding of water on the soil surface. Still something must have happened to the N based on the stalk nitrate test. Stalk nitrate averaged only 528 ppm in the high input treatment compared with 345 ppm in the recommended input treatment, (Fig.1), both in the 250-750 ppm marginal stalk nitrate levels for maximum yield. We did sample for stalk nitrate concentrations about 4 weeks after black-layer formation instead of the recommended 0 to 3 weeks after, which could have contributed somewhat to the low values. Still it is doubtful that 1 week late for sampling would have such a huge effect, so it looks like both the high and recommended management treatments had marginal N status at harvest. The wet June conditions, especially the 1.75 inch precipitation event 2 days after side-dressing, should have favored a response to the high N management treatment. On the other hand, conditions became dry from early July through mid-September with only 2.8 inches of precipitation in July, 1.4 inches in August, and ~1.35 inches through 20 September, black layer formation. The dry conditions probably reduced the yield potential at this site (we averaged over 210 bushels/acre in 2013 and 2014 on the same fields), which probably reduced the potential yield response to elevated N rates.

The dry conditions undoubtedly reduced the probability of a response to high seeding rates, as indicated by yield component analyses (Fig.2-5). We subsampled two 1 meter lengths of the two center rows (hand-harvested all the plants, pulled off the ears and dried them, shelled the ears, counted the kernels, and weighed all the kernels-~6000-7000/sample or 12000-14000 kernels/plot) in two regions of our 100 foot plots about a week before harvest (10/26). When averaged across the three previous crops of 2014, plant populations in the sub-sampled areas averaged 8.62 plants/m2 (~34,900 plants/acre) in the high input management treatment compared with 7.29 plants/m2 (29,515 plants/acre) in the recommended management treatment (Fig.2). Our sub-sample values were slightly higher than the final populations at the V10 stage when we counted all the plants in the two center rows along the entire 100 foot plot length (34,265 plants/acre in the high input and ~28,500 in the recommended management input treatment https://blogs.cornell.edu/whatscroppingup/2015/07/23/emergence-early-v4-stage-and-final-plant-populations-v10-psnt-values-v4-and-weed-densities-v12-in-corn-under-conventional-and-organic-cropping-systems/). Nevertheless, the estimated plant populations in the sub-sample are < 5% higher than populations in the entire plot so we believe that our sub-sample is very representative of the entire plot.
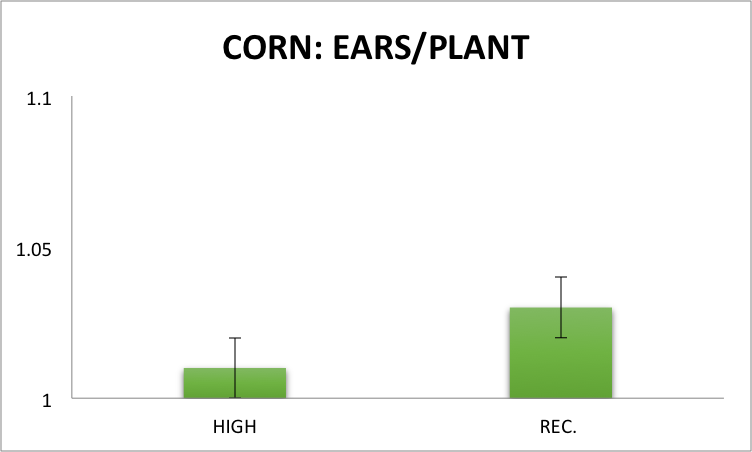
When averaged across the three previous crops, corn averaged 1.01 ears/plant in high input management and 1.03 in recommended input management in the conventional cropping management system (Fig.3). Typically, hybrids, even modern hybrids, will produce a second ear under low plant populations, although 7.29 plants/m2 is not that low a final stand. Although ears/plant were statistically different, actual differences between the two management systems were probably not of sufficient magnitude to have a major influence on final yield.

When averaged across the three previous crops, corn averaged 542 kernels/ear in high input management and 572 kernels/ear in recommended input management (Fig.4). Again, corn at lower seeding rates typically have greater kernels/ear than corn hybrids at higher seeding rates because of less intra-plant competition for light, water, and nutrients. Likewise, corn hybrids at higher seeding rates typically have lower seed mass (weight of an individual kernel) than at lower seeding rates because of greater intra-plant completion, as was the case in 2015. When averaged across the previous crops, seed mass averaged 246 mg in the high management treatment and 262 mg in the recommended management treatment (Fig.5). If you multiply out the yield components (plants/m2 x ears/plant x kernels/ear x kernel weight), the sub-sample yields averaged 184 bushels/acre in the high input management compared with 179 bushels/acre in the recommended input management treatments. Although the sub-sample yields were ~11% greater than the actual plot yield, the differences between treatments were exactly the same, a non-significant 2.5 to 2.8% yield difference. So why no response to high input management in 2015? The increase in plant number at high seeding rates was offset by an increase in kernel number/ear and kernel weight at the recommended seeding rate, resulting in no significant yield difference between treatments. We have observed this time and time again under NY growing conditions. (PDF File: aj-104-4-945.pdf, PDF File: aj-105-3-693.pdf)

CONCLUSIONS:
We will continue this study for two additional years and hopefully we will have growing conditions that favor positive yield responses to high seeding/N rates. Although July and August were cool at the Aurora Research Farm (2.5 to 1.5 degrees below normal, respectively), the dry conditions contributed to premature senescence of the corn crop in late August, regardless of management inputs. We have a tile drain every 33 feet on our Honeoye soil, which allows for early planting, but unfortunately accentuates dry soil conditions in August. Corn silked ~July 26-28 and conditions were not very stressful from late July through mid-August so kernel set and kernel retention probably was not affected by adverse weather conditions. But the dry soil conditions and the very warm first half of September contributed to premature senescence, which probably reduced seed weight, especially under higher plant populations. Consequently, there was no response to higher seeding rates at Aurora in 2015. If you are thinking of seeding rates above our recommended 30,000 plants, acre, make sure that you are on soils that are not droughty and the selected hybrid is known to respond to high seeding rates. So far we have not been able to find that successful combination.
