Tuesday afternoon, May 20, 2014: Weather forecasters have adjusted their predictions, and the slightly cooler temperatures predicted have resulted in reduced risks for additional fire blight infections later this week. The potential infection periods that were predicted yesterday disappeared when I inserted the new forecast into the MaryBlyt model using data from the Highland-HVL NEWA station and predicted temperatures from AccuWeather (see below). Blossom blight infections may occur again next week (May 26-28) for newly planted trees and/or European cider apple varieties that are still blooming then, but it appears that major risks for infection of blossoms on bearing trees in the lower Hudson Valley this year occurred on May 11 and May 15. Any wetting on 12-14 May could also have triggered infections, but no wetting occurred on those dates in our Highland orchards.
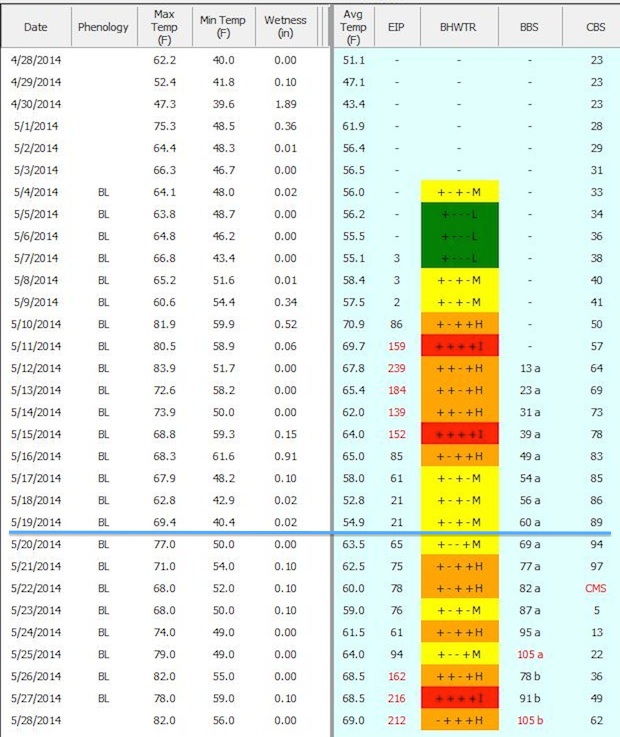
In the MaryBlyt output shown above, data below the blue horizontal line are from AccuWeather forecasts. The column labeled “EIP” (epiphytic infection potential) indicates when flowers have been exposed to enough heat (degree hours >65 F) to become infected. The heat requirement is fulfilled when EIP ≥100. In the column labeled BHWTR, the respective columns will show a “+” if the following conditions are met: B — open flowers; H— EIP>100; W— wetting from any rain, dew, or pesticide application on that day or >0.1 inch rain the previous day; T— mean temperature for the day is >60F. The final letter in that column will be an “I” indicating infection is likely if all of the other columns show a “+”, or the last column will be “H” for high risk if only three of the former criteria are met.
The column labeled “BBS” provides a prediction of when blossom blight symptoms might appear on trees. Symptoms from the 11 May infection event should appear on 25 May (i.e., when numbers in the BBS column exceed 100). Symptoms from the second infection period should appear on 28 May when numbers in the BBS column that are followed by a “b” finally exceed 100. In reality, the very early symptoms are often apparent only to very careful observers and it takes a few more days before the wilting-shoot symptoms become apparent to the casual observer.
Personally, I prefer to use the MaryBlyt model for timing blossom blight sprays rather than the Cougar Blight model that is available on the NEWA network. The MaryBlyt model can be downloaded from http://www.caf.wvu.edu/kearneysville/Maryblyt/index.html, along with a manual that provides full documentation. The disadvantage of using MaryBlyt is that the user must enter the maximum and minimum temperatures and rainfall for each day. The advantage is that MaryBlyt model will accept multiple spray dates (in columns that I removed from the example above). The model will adjust the output to indicate what risks will be after adjusting for any strep sprays that were applied. Using that function showed that a single strep spray could not adequately protect against infections on both 11 May and 15 May under our conditions at Highland. Thus, anyone with fire blight inoculum in their orchards should have applied at least two strep sprays this year sometime between 10 May and 16 May. We should know within two weeks just how effective those sprays actually were.
