Zipf’s Law for Cities – A Simple Explanation for Urban Populations
A quick glance at the list of the most populous cities in the United States reveals a very interesting, though apparently random trend. The most populous city, New York City (population 8.2 million according to the 2010 census), has approximately twice the population of the second most populous city (Los Angeles, population 3.9 million), three times the population of the third most populous city (Chicago, 2.7 million), and four/five times the populations of the fourth/fifth most populous cities (Houston, 2.1 million, and Philadelphia, 1.5 million). This trend in rank vs. frequency continues for nearly all “mega-cities” (population centers of over 100,000 people) in the United States (see graph below from a 1999 paper by economist Xavier Gabaix). This phenomenon is commonly referred to as Zipf’s Law, after linguist George Zipf, who, in 1949, observed a similar pattern for word-usage frequency in several different languages. Surprisingly, Zipf’s Law does not just hold true for cities in the United States, but rather it has been correlated with urban population totals in nearly every developed country across the world. Additionally, it works well when “Metropolitan Areas” are used – cities defined by the natural distribution and connectivity of populations rather than arbitrary political boundaries (i.e. counting Oakland and San Francisco California, or Boston and Cambridge Massachusetts as a singular Metropolitan area, rather than two different cities). 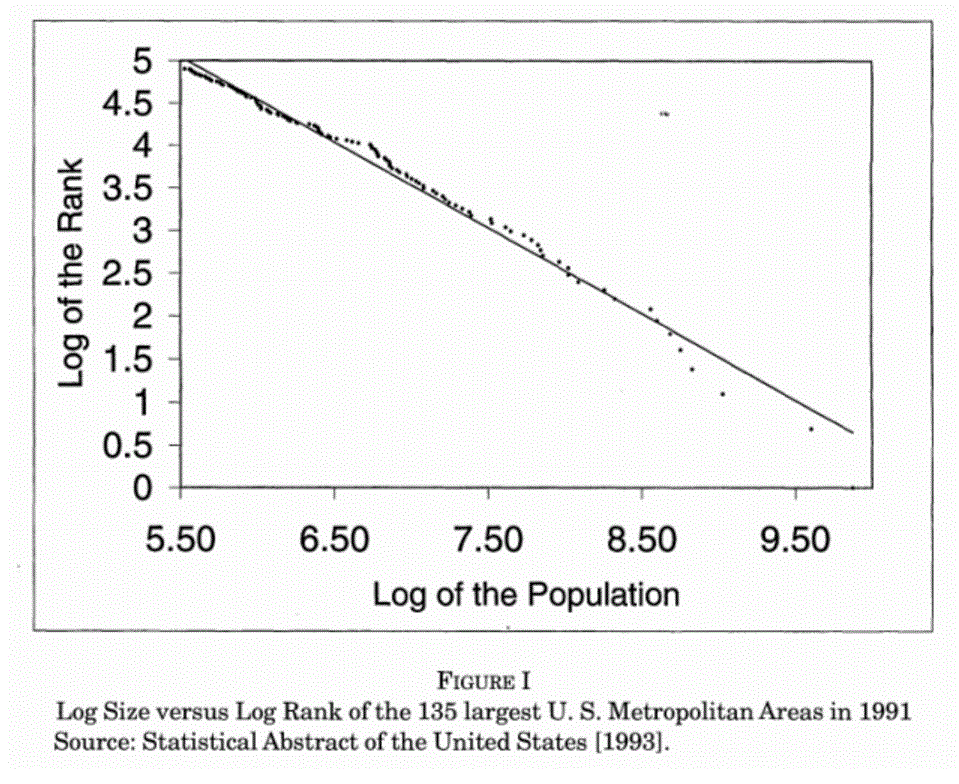
The rank vs. frequency graph, shown above as a log-log plot with a linear slope, indicates that Zipf’s Law is in-fact an example of a power-law. As discussed in class, power-laws often result from a “rich-get-richer” phenomenon, while normal distributions are the result of a number of independent events. This could certainly partially explain the phenomenon of Zipf’s Law as it applies to cities. Larger cities are often hubs of wealth and innovation, attracting both immigrants and those who previously dwelt in more rural parts of a country. Therefore, it makes sense that the largest, large cities would be relatively more attractive than smaller, large cities. Further support for the power-law theory come indirectly from a 2012 paper that studied city populations in the European Union, and found that Zipf’s Law did not hold. However, it did find that the rank vs. frequency pattern could be found for individual countries within the EU. The study concluded that Zipf’s Law for cities is observed for regions that grow as a single geopolitical and economic unit (such as the United States), but not for regions wherein this has not historically been the case (such as the European Union, which has only existed as a economic unit for a couple of decades). The growth of cities in the E.U. was a more independent process than the growth of cities in an economic unit, such as the United States, or a country within the E.U. This conclusion emphasizes the how Zipf’s Law can be partially explained by the interdependent nature of a power law distribution.
Citation: http://io9.gizmodo.com/the-mysterious-law-that-governs-the-size-of-your-city-1479244159
I can’t find any log base that will reproduce this graph on the 148 largest cities.