Modeling Traffic, Gridlock and Bottlenecks
After infamous “bridgegate” scandal, where the administration of the Governor of New Jersey Chris Christie planned a “bridge gridlock”, the issue of how traffic is caused should be examined. It is firstly important to not the distinction between gridlock and bottlenecks. A bottleneck is when there is some slowing zone that causes cars to build up, but eventually pass through at normal speeds. A gridlock is when multiple bottlenecks build onto each other, preventing cars from moving past the problem because they are blocked by the queue from another bottleneck. This is shown in the interactive graphic in the link posted below.
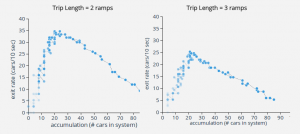
These graphs demonstrate traffic congestion by showing how exit rate changes as the number of cars accumulates. The curve that fits the slope is called the Network Exit Function or NEF. One can see cars are able to exit the cycle much more easily when the trip length is shorter. On the far right of both graphs is hypercongestion ,which is where the exit rate continues to fall so that the network builds up, preventing cars from exiting. The NEF is important for timing traffic signals and ramp meters that can be used to control bottlenecks and prevent gridlock from happening.
http://setosa.io/blog/2014/09/02/gridlock/