Identifying Online Fraud Using Networks
Lyft and Uber, the two big names in car sharing software, have recently accused each other of sabotage. In particular, Lyft claims it has found several Uber employees ordering many rides from Lyft and canceling the rides at the last minute, costing drivers time and money. For example, “one Lyft passenger, identified by seven different Lyft drivers as an Uber recruiter, canceled 300 rides from May 26 to June 10. That user’s phone number was tied to 21 other accounts, for a total of 1,524 canceled rides” [1]. In total, Lyft estimated there were about 5,560 such rides between August 12 and October 3 of this year.
One way to identify this type of activity is to look at the network graph of users, IP addresses, and orders, and identify large connected components [2]. A graph could be constructed by connecting users with their orders and the IP address they use. A typical user’s interactions will look small and self-contained — the user will be at the middle and will connect to a few orders and the one or two addresses it uses to connect to the service. The longest path in the component will consist of one or two edges.

A typical user
A fraudulent user, on the other hand, will typically use multiple accounts, but these will be connected to the same IP address. This will create large connected components in the network. If a large proportion of the orders in the component have been cancelled, chances are the accounts are being used by one user for fraudulent purposes.
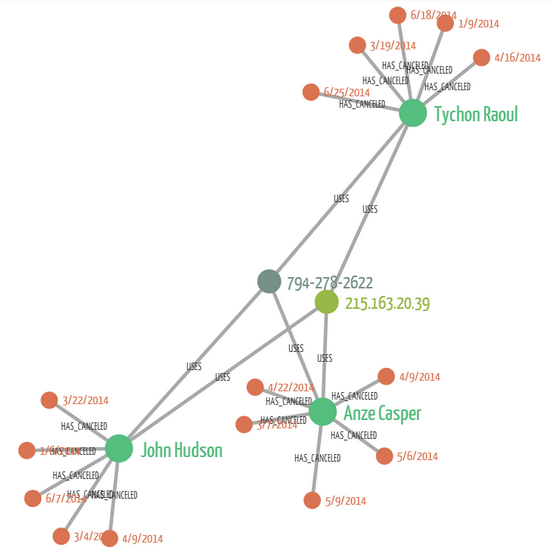
A fraudulent user
A similar technique is used at Victiv.com, which is a fantasy sports website hosting games with prizes up to $100,000 [3]. The site gives new users $30 to play for free, and an additional $20 for referring friends to play. This gives fraudulent users an incentive to try to create multiple accounts and refer them to each other to accumulate money to play. By generating network graphs where users and IP addresses are nodes and users and their login IP addresses are connected with an edge, users which are using multiple accounts can be identified by finding large connected components, which are only possible when many users share the same IP addresses.
These two examples illustrate how using network graph analysis intelligently can have real-world uses in fraud detection. Even simple tools such as the concepts of connectedness introduced in class can go a long way in preventing large monetary losses to fraudulent user activity.
[1] http://money.cnn.com/2014/08/11/technology/uber-fake-ride-requests-lyft/
[2] https://linkurio.us/lyft-vs-uber-visualizing-fraud-patterns/
[3] http://rotoquant.com/2014/10/31/we-got-99-problems-but-fraud-aint-one/