Strong and Weak Ties of Ebola interactions
West Africa is experiencing right now the worst Ebola outbreak in its history. While it seems that it is virus is localized, in a matter of months the disease spread quite rapidly from Guinea to Sierra Leone to Liberia to Nigeria. Furthermore, it has spread to major cities in Sierra Leone, which include airports. Ebola is incredibly fatal, 90% of those who contract the virus will die. However, despite the alarmingly increasing outbreak statistics, the disease is not as contagious as people assume it is. Unlike the common cold, Ebola can only spread through contact with the infect person’s bodily fluids (most likely blood or vomit). The spread of the contagion has been through improper containment of those who have been near infected and equally improper precautions taken by physicians, as some people suspect. Certain state and national governments have taken precautions by containing entire neighborhoods and towns in a sort of barricade, prohibiting people in the same neighborhood as an Ebola victim to leave. The main problem is that the virus continues to spread because people who were at minimal risk of contracting the virus are put together with those who were at a high risk of contracting the virus.
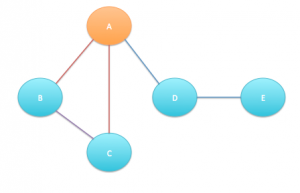
However, the spread of the contagion in neighborhoods can be represented in a simple networks graph of strong and weak ties. For specificity purposes, the network will represent a neighborhood with a known Ebola victim. The nodes represent the people in the neighborhood, including the physicians who handled the infected body. The infected body will be presented by a “special” node (colored) to emphasize the source of infection in the village. The edges between the nodes represent any sort of contact between those people. To specify the contact between the two nodes, or people, the edges will be labeled with strong or weak ties. Strong ties represent close, interpersonal relationships, which includes continual contact creating a high risk of contact with their bodily fluids. Strong ties include also contact made by physicians. Weak ties represent loose interpersonal relationships, like acquaintances, in which incidental contact at minimum could have occurred with the infected person.
The orange node represents the Ebola victim, and the blue nodes represent three different people from the neighborhood (this is a portion of the network of the neighborhood). The red edges are strong ties and the blue node is a weak tie. The purple tie represents the possibility of nodes B and C to infect each other because they are both have strong ties to the Ebola victim (possibly node B is a physician and node C is a friend of node A). From the network, one can derive a more specific method of isolating those who could be potential agents of the virus. Here, nodes B and C are at high risk of contracting the virus, while D is at a lower risk. At a very minimal risk is node E who is only connected to the Ebola victim by two weak ties; hence, node E does not need to be contained with Nodes B and C (containment of those nodes together could perpetuate the virus further because of closer contact).
While this network is an oversimplification of the situation, it provides an insight into how to properly contain the virus by isolating those with an actual risk of contagion rather than potentially endangering those who were not at originally at a risk.
Information regarding this blogpost was found on the New York Times.
http://www.nytimes.com/interactive/2014/07/31/world/africa/ebola-virus-outbreak-qa.html?_r=1

