Using Graph Theory to Diagnose Mania and Schizophrenia
The first few lectures in INFO 2040 have focused on graph theory and its applications to the study of networks. In class, we learned about using graph theory to model credit card transactions, Internet connections, and medical donations. In addition to these applications, a recent study published in the renowned open access scientific journal, PLOS ONE, details the use of graph theory to assess and diagnose mental disorders based off of a patient’s speech. The study was conducted at Federal University of Rio Grande do Norte in Brazil. Two of the most common causes of psychosis are mania and schizophrenia. Manic patients tend to display speech patterns that include logorrhea (excessive wordiness) and “flight of thought” (deviations from the current topic). In contrast, schizophrenic patients show poor speech patterns and dwell on the same subject. To this day, doctors diagnose one disorder versus the other through psychiatric interviews with the patient. However, a single doctor’s assessment of the patient’s body and verbal language during such interviews can be highly objective. Luckily, that’s where graph theory comes to play.
In this study, graph theory was used to study speech patterns of both manics and schizophrenics in hopes of creating a less objective and more quantitative means of patient diagnosis. The study generated graphs in which each word that the patient said was represented as a node. The semantic and grammatical relationships between such words were represented as edges. Oral interviews were conducted on 8 manic patients, 8 schizophrenic patients, and 8 control patients without mental disorders. Individual differences in speech patterns were accounted for when acquiring patient data. An example of graphs acquired from the study is shown below.
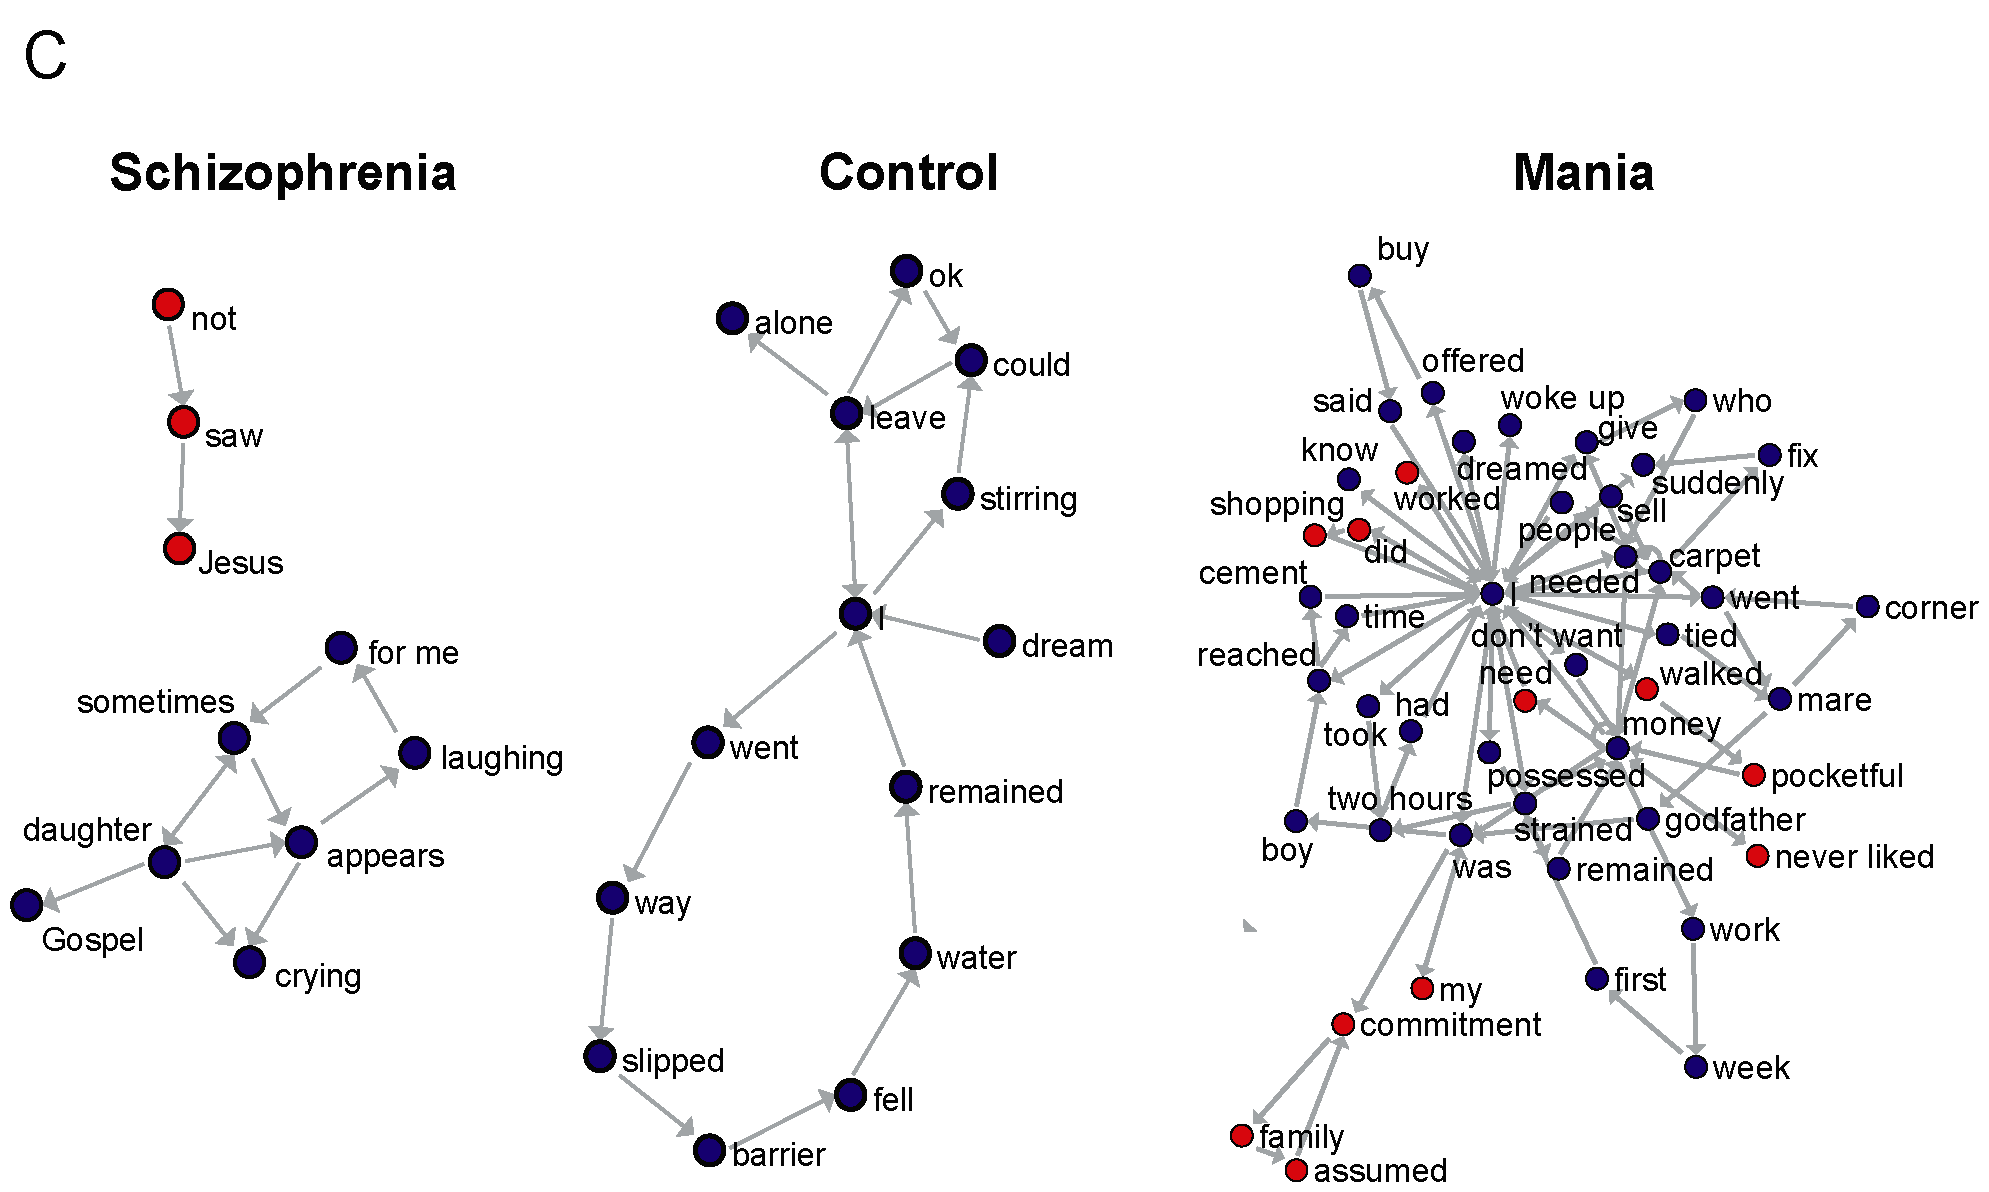
Results from the study showed that graphs obtained from manic interviews overall had more nodes (around 30 per interview) than those of schizophrenics (20 per interview). Similarly, graphs from manic interviews had more edges than those from schizophrenics. This increase in nodes and edges in graphs from manics reflects a manic patient’s tendency to use excessive words and deviate from the current topic. In contrast to graphs from manics, schizophrenic patients produced speech graphs with more edges connected to the same nodes or words. Such a recurrence of words in the patient’s speech reflects a schizophrenic patient’s tendency to address a single topic. Thus, just by graphing the speech patterns of a patient, doctors can more easily make a diagnosis based off the number of nodes and edges. Such an application of graph theory shows that it is not only a powerful tool in analyzing social networks, but also in diagnosis for the medical world as well.
The article
http://www.plosone.org/article/info%3Adoi%2F10.1371%2Fjournal.pone.0034928