The NHL Lockout and Game Theory
Recently, the National Hockey League (NHL) owners and players union have become entangled in a dispute over the Collective Bargaining Agreement that decides the sharing of revenue between the players and owners. Sports fans are no strangers to these Lockouts: In 2011, Preseason NFL games and practices were cancelled due to ongoing disputes and 16 NBA games were cut from the 2011-2012 season thanks to related delays. The NHL alone has had 4 labor disputes in the past 20 years, with the entire 2004-2005 being cancelled as a result. These types of disputes can cause billions of dollars in losses, yet negotiations still lag behind for reasons that become apparent when analyzed through the lens of Game Theory.
First, let’s establish some figures. In 2011-2012, the NHL posted Hockey Related Revenues of 3.28 Billion Dollars. The Player Union is suggesting a deal that would give an average of 52.78% revenue to players and 47.22% to Owners for 5 years, while the Owners are pushing for a deal over 6 years that, over 5, would give an average of 47.7% to players and 52.3% to owners. For simplicity’s sake, we will assume the deal is for 5 to compare the two deals over a similar time frame.
Similarly, for the following Games, we will assume each side can Cooperate or Not Cooperate. (C,C), in (Player,Owner) form, will result in an average of the two deals, (C,NC) will result in the Owner’s deal, (C,NC) the player’s deal, and (NC,NC) in a season cancellation and no revenue.
Percentage of Revenue
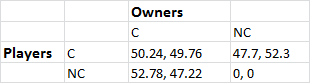
From this, we can recognize two pure Nash Equilibria: (NC,C) and (C,NC). Intuitively, this makes sense: The player’s want their best result: (NC,C) = 52.78%, and the same can be said of the other equilibrium for the owners. This would explain the holdout, as, while both sides are not cooperating, such as now, one side accepting the other’s deal would result in a better scenario for those who wait longer. The danger in this comes from the fact that if it goes on too long and a deal is never reached, (NC, NC), revenue could be lost, as shown below.
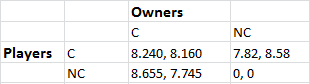
Note: The following Revenues are projected from the $3.28B revenue from 2011-2012.
Revenue after 5 Years of Corresponding Deal (in bil. USD)
Revenue after 1 year lockout & 4 Years of Corresponding Deal (in bil. USD)
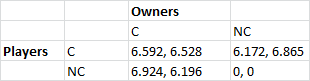
In any case (save for the NC, NC pairs, which are intuitively terrible) after a cancelled season, revenue is strictly lower than any revenue from accepting a 5 year deal. Yet still, Lockouts occur. Why not just co-operate on a deal before the season is lost and your revenue takes an irrecoverable hit? The answer lies within the power balance between the two sides, and who wants to make a bigger impression to obtain more influence, creating an unbalanced network when the next negotiation comes around. At the end of the day, this analysis through Game Theory serves as a strong reminder that networks are complex, and that the sensible, mathematical answer isn’t always reached. Life is more than just numbers.
– T$
Source: http://www.theglobeandmail.com/sports/hockey/globe-on-hockey/measuring-the-nhl-nhlpa-divide-oh-about-1-billion/article4541634/