
By: Andrew Harrison
The aim of this tool is to aid producers in evaluating bull selection through comparing trait values of their herd with those of the bulls selected and evaluating the expected economic gain using either Net Merit, Fluid Merit, Cheese Merit or Grazing Merit economic values per PTA gain.
This will allow producers to analyse bull selections from an economic standpoint by utilising the herd’s current genomic status and calculating the estimated generational gain from the proposed matings. The NM 2014 (NM, FM, CM, GM) economic values are then used to attribute an economic value on the changes in Predicted Transmitting Ability (PTA).
The link below contains the spreadsheet which will calculate the economic impact.
Economic Impact of Bull Selection on Genomically Tested Herds
The link below has the instructions for use which will aid the user in using the program.
The Program
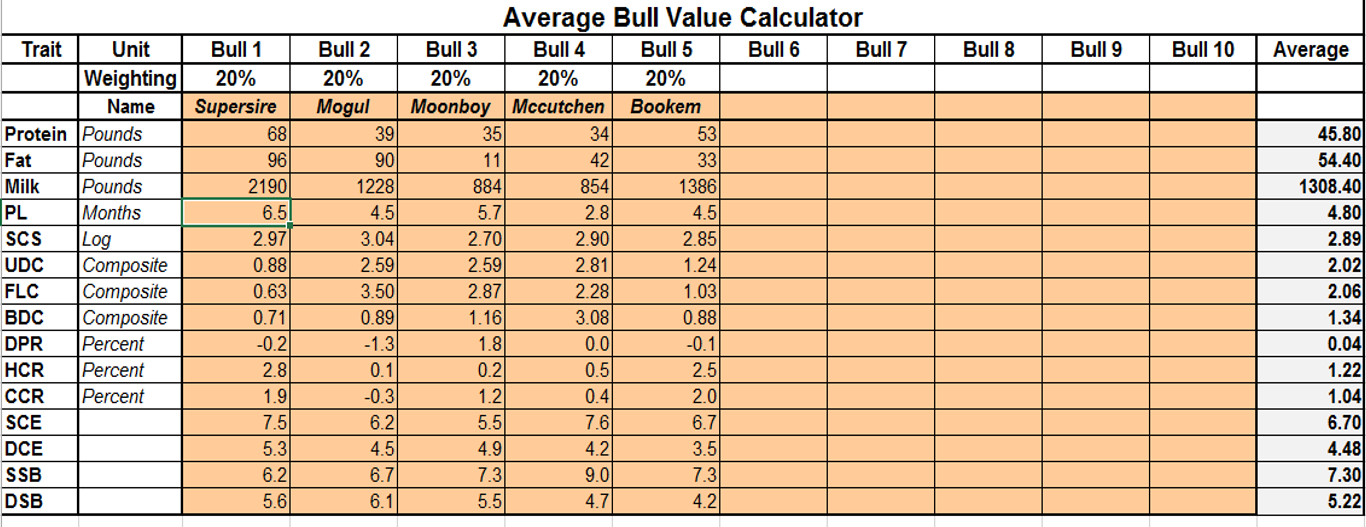
This is the first screen which the user will see when the spreadsheet is opened. It is a tool to calculate the average PTA values for the bulls traits, taking into account the weighting of how much the bull is being used within the group of cattle being analysed.
Here I have entered as an example the top 5 NM$ bulls provided by Select Sires. I have entered all of their PTA trait information and they are being used equally amongst the group and so I have entered a 20% weighting for all of them.
For example if I was using Supersire on 40% of the herd and the rest on 15% of the herd each, the averages would be weighted accordingly. The average is then automatically moved onto the ‘Economics of Bull Selection’ tab.
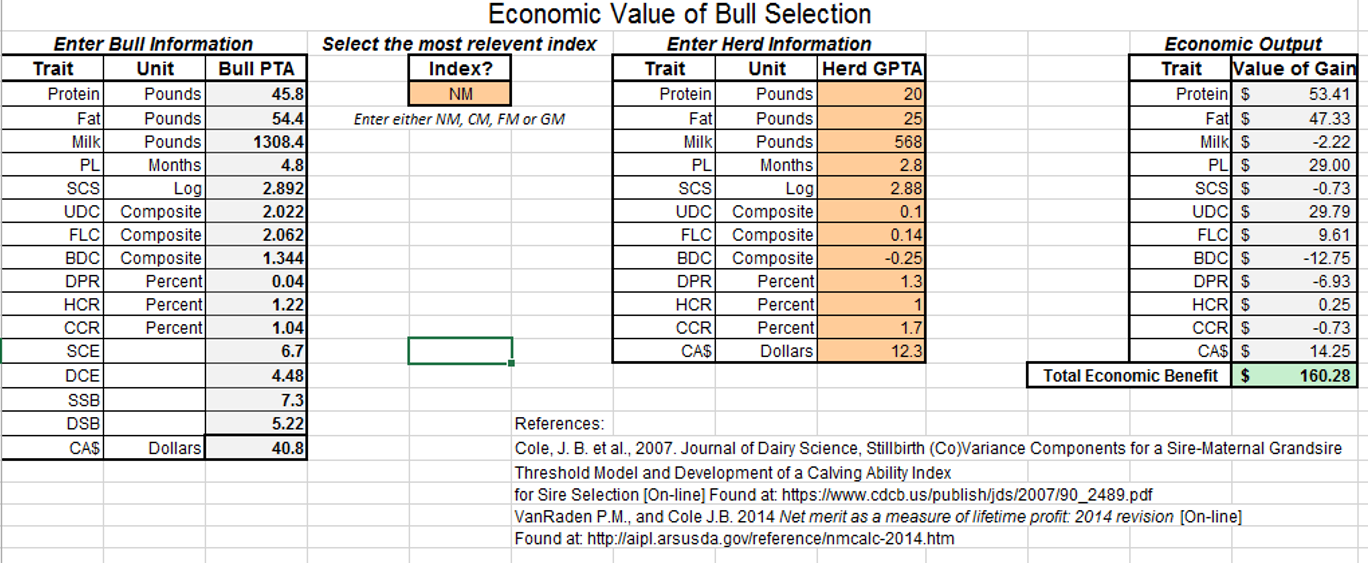
Here is the second tab in the spreadsheet, which calculates the economic values. The information from the previous tab is displayed on the right hand side, with the Calving Ability $ calculated used John Cole’s published formula¹. This allows an economic value to be attributed to the four calving ease parameters found in bull proofs (SCE, DCE, SSB, DSB).
The user then selects which index best corresponds to their management practices, using NM, CM, FM and GM to best identify their herd. Their herds GPTA scores are then entered into the herd information box, to identify the level of genetic progress between generations. For this example, the Cornell University Research Centre dairy heifers scores have been used.
The Net Merit 2014 economical values² are applied to the generational gain to produce an economical value for each trait which are then summed to create an overall economical value. This shows the likely increase in profit from on generation from the next based on the bulls selected, and so the bulls used, or the weightings of each bulls used can be altered to provide the greatest economic return, and thus it can be used as a selection tool.
¹ Cole, J. B. et al., 2007. Journal of Dairy Science. Stillbirth (Co)Variance Components for a Sire-Maternal Grandsire Threshold Model and Development of a Calving Ability Index for Sire Selection [On-line] Found at: https://www.cdcb.us/publish/jds/2007/90_2489.pdf
² VanRaden P.M., and Cole J.B. 2014 Net merit as a measure of lifetime profit: 2014 revision [On-line] Found at: http://aipl.arsusda.gov/reference/nmcalc-2014.htm