
by Paul Allen
At Cornell, as engineers contemplate moving infrastructure and applications to AWS it is tempting to ask whether they can start just by moving database instances to the AWS Relational Database Service (RDS) and leaving other application components on premise. The reasons behind this probably stem from the fact that the on-premise relational databases represent a very well-defined component with well-defined connectivity to other components. And, tools like the AWS Database Migration Service promise to make the move fairly painless.
So, how feasible is it to leave applications on campus while using an RDS database as a back end? When I queried the Cornell cloud community about this, I got several anecdotal responses that this had been tried, without much success, with web applications.
This post describes an attempt to add some real numbers to the discussion. If we run the same SQL workload against RDS using clients from two different locations, that should give some indication how the location impacts database performance as perceived by each client. If one client is on campus and the second client is in EC2 (in the same availability zone as the RDS database instance), the comparison should highlight what impact network latency between database and client has.
Benchmarking Components
A MySQL instance on RDS. I fired up an AWS RDS MySQL (v5.7.11 ) instance using an instance type of db.t2.micro and 5GB of space. I did not use a multi-Availability Zone configuration.
sysbench software. I used the database tests from https://github.com/akopytov/sysbench (branch 0.5). This package was downloaded to each client and compiled according to directions in the repo.
Campus MySQL client. This is a recent MacBook Pro (2.5 GHz Intel Core i7, OS X v10.11.5) wired into the campus network on a 1Gbit/s connection. The MySQL client was Ver 14.14 Distrib 5.7.11, for osx10.11 (x86_64).
EC2 MySQL client. This is a c4.xlarge EC2 instance running the AWS linux (Amazon Linux AMI 2016.03.1 (HVM), SSD Volume Type – ami-f5f41398). All updates were installed, and additional RPMs were added so that the sysbench software would compile. I chose the c4.xlarge instance type because I wanted to make sure it had 4 virtual CPUs, the best match I could make to the 4 virtual cores in my laptop.
VPC connectivity. The private subnet I used to deploy the RDS and EC2 instances is in an AWS VPC and connected to campus using AWS Direct Connect. Both the RDS instance and EC2 instance resided on the same private subnet. Typical round trip time from campus to EC2 instances on that subnet are around 15ms.
Commands
First, I connected to my MySQL instance and created the database that sysbench with the following SQL:
create database sbtest;
Next, I setup the tables that sysbench needs to run the benchmarks. It doesn’t matter which client you use for this:
$ sysbench/sysbench \
 --mysql-host=XXXXXX.cup2kudlch8b.us-east-1.rds.amazonaws.com \
 --mysql-user=XXXXXX \
 --mysql-password=XXXXXX \
 --test=sysbench/tests/db/parallel_prepare.lua  \
 --oltp-tables-count=64 \
 --num-threads=1 \
 run
Next, I ran the following command on each client three times, with num-threads=1, 4, and 8.
$ sysbench/sysbench \
 --mysql-host=XXXXXX.cup2kudlch8b.us-east-1.rds.amazonaws.com \
 --mysql-user=XXXXXX \
 --mysql-password=XXXXXX \
 --test=sysbench/tests/db/oltp.lua  \
 --oltp-tables-count=64 \
 --num-threads=1 \
 --max-time=60 \
 run
Results
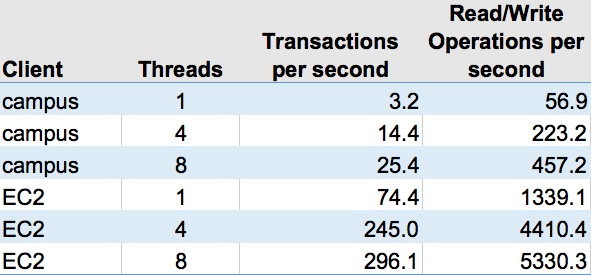
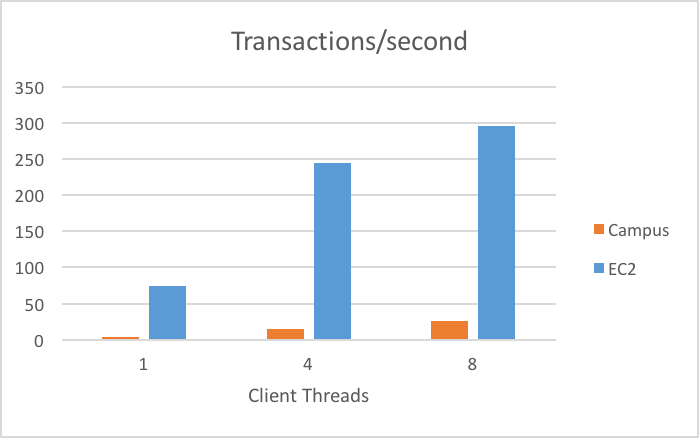
The numbers are fairly incredible (Table 1). Database performance as perceived by the clients in different locations differed by orders of magnitude. The results from a single client thread are the easiest to interpret. A single thread database client can complete only about 57 INSERT/SELECT/UPDATE operations per second, compared to more than 1,300 for a similar client running on EC2. That’s 20X more operations per second from the EC2 client compared to the campus client. Even if we thought that the clients or database were maxing out network, memory, or CPU, we could focus solely on the results for the single client thread and still come away with meaningful conclusions.
When running these benchmarks, I didn’t rigorously monitor or collect detailed information about the system metrics on either the clients or the RDS instance. I was mildly surprised that the RDS instance didn’t seem to be taxed for any of these workloads, even though the instance type was very small. Likewise I got no indication that the on-campus client was working hard at all.
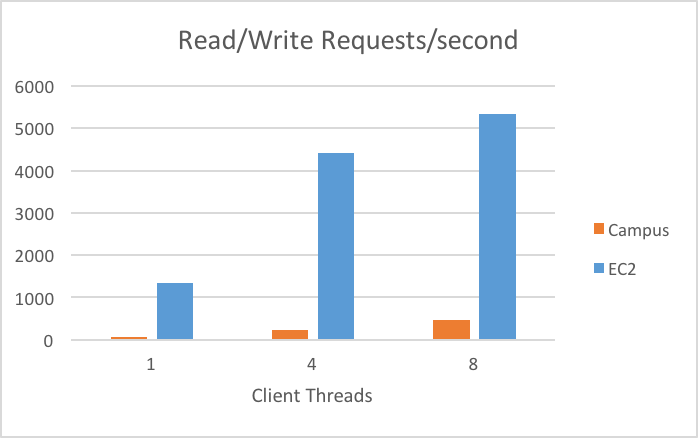
Comparing the results for 1-thread and 4-threads, the performance for both clients scaled according to the number of threads. In the jump from 4 threads to 8 threads, results scale according to the number of threads for the campus client, but less than that for the EC2 client. We’d have to take a closer look at client and database system metrics to explain the less-than-doubling of performance between the 4-threaded and 8-threaded results for the EC2 client.
Conclusion
It appears that it could be fairly easy for a single thread of an on-campus application hitting a cloud-based database to run into practical limits to the rate of SQL operations it can perform. It’s useful to point out that the SQL workload that sysbench runs probably isn’t very similar to what a real application would present to a database. The point here is that for the same SQL workload, we are seeing very significant impact on perceived performance, presumably due to network latency.
If you really want to use an RDS database while leaving an application on-premise, it would be best to minimize the impact of network latency by re-architecting the database access within the application to package up larger chunks of SQL or use stored procedures in order to minimize the number of round trips between the database and the application. Or, even better, create a REST-based API that could live in the cloud (e.g., AWS API Gateway + AWS Lambda), thus moving the fine-grained back-and-forth of SQL execution entirely to the cloud.
There is a possibility that the differences between the on-campus client and the EC2 client could be due to client software or configuration. If I were to do it again, I’d use a Docker container to run sysbench. That way, the on-campus client would be exactly the same as the EC2 client. Also, if I were to do further benchmarking, I’d probably use a larger RDS instance type and pay more attention to the system metrics of the database and client systems. I’d also consider using mysqlslap in order to create a more realistic workload.
Acknowledgements
Thanks to the sysbench creators and contributors and also to Balazs Pocze and his article on MySQL benchmarking using sysbench. Also thanks to the Cornell Cloudification Team for feedback on this article.
Appendix – Detailed Results
Campus client – 1 thread
Note that the benchmark reached the 60-second time limit and was shut down prior to completing all operations.
OLTP test statistics:
 queries performed:
 read: 2660
 write: 760
 other: 380
 total: 3800
 transactions: 190 (3.16 per sec.)
 read/write requests: 3420 (56.93 per sec.)
 other operations: 380 (6.33 per sec.)
 ignored errors: 0 (0.00 per sec.)
 reconnects: 0 (0.00 per sec.)

General statistics:
 total time: 60.0705s
 total number of events: 190
 total time taken by event execution: 60.0697s
 response time:
 min: 311.05ms
 avg: 316.16ms
 max: 370.46ms
 approx. 95 percentile: 319.94ms
Campus client – 4 threads
Note that the benchmark reached the 60-second time limit and was shut down prior to completing all operations.
OLTP test statistics:
 queries performed:
 read: 2660
 write: 760
 other: 380
 total: 3800
 transactions: 190 (3.16 per sec.)
 read/write requests: 3420 (56.93 per sec.)
 other operations: 380 (6.33 per sec.)
 ignored errors: 0 (0.00 per sec.)
 reconnects: 0 (0.00 per sec.)

General statistics:
 total time: 60.0705s
 total number of events: 190
 total time taken by event execution: 60.0697s
 response time:
 min: 311.05ms
 avg: 316.16ms
 max: 370.46ms
 approx. 95 percentile: 319.94ms
Campus client – 8 threads
Note that the benchmark reached the 60-second time limit and was shut down prior to completing all operations.
OLTP test statistics:
 queries performed:
 read: 21434
 write: 6121
 other: 3061
 total: 30616
 transactions: 1530 (25.39 per sec.)
 read/write requests: 27555 (457.23 per sec.)
 other operations: 3061 (50.79 per sec.)
 ignored errors: 1 (0.02 per sec.)
 reconnects: 0 (0.00 per sec.)

General statistics:
 total time: 60.2652s
 total number of events: 1530
 total time taken by event execution: 481.5003s
 response time:
 min: 302.77ms
 avg: 314.71ms
 max: 1556.78ms
 approx. 95 percentile: 322.93ms
EC2 client – 1 thread
Note that the benchmark reached the 60-second time limit and was shut down prior to completing all operations.
OLTP test statistics:
 queries performed:
 read: 62496
 write: 17856
 other: 8928
 total: 89280
 transactions: 4464 (74.39 per sec.)
 read/write requests: 80352 (1339.10 per sec.)
 other operations: 8928 (148.79 per sec.)
 ignored errors: 0 (0.00 per sec.)
 reconnects: 0 (0.00 per sec.)

General statistics:
 total time: 60.0044s
 total number of events: 4464
 total time taken by event execution: 59.9891s
 response time:
 min: 11.11ms
 avg: 13.44ms
 max: 136.74ms
 approx. 95 percentile: 17.49ms
EC2 client – 4 threads
OLTP test statistics:
 queries performed:
 read: 140014
 write: 40004
 other: 20002
 total: 200020
 transactions: 10001 (245.02 per sec.)
 read/write requests: 180018 (4410.41 per sec.)
 other operations: 20002 (490.05 per sec.)
 ignored errors: 0 (0.00 per sec.)
 reconnects: 0 (0.00 per sec.)

General statistics:
 total time: 40.8166s
 total number of events: 10001
 total time taken by event execution: 163.2311s
 response time:
 min: 11.96ms
 avg: 16.32ms
 max: 205.46ms
 approx. 95 percentile: 19.11ms
EC2 client – 8 threads
OLTP test statistics:
 queries performed:
 read: 140014
 write: 40003
 other: 20001
 total: 200018
 transactions: 10000 (296.10 per sec.)
 read/write requests: 180017 (5330.26 per sec.)
 other operations: 20001 (592.23 per sec.)
 ignored errors: 1 (0.03 per sec.)
 reconnects: 0 (0.00 per sec.)

General statistics:
 total time: 33.7726s
 total number of events: 10000
 total time taken by event execution: 270.1505s
 response time:
 min: 11.42ms
 avg: 27.02ms
 max: 286.48ms
 approx. 95 percentile: 33.13ms