
Week Five: NDVI for Nitrogen Management

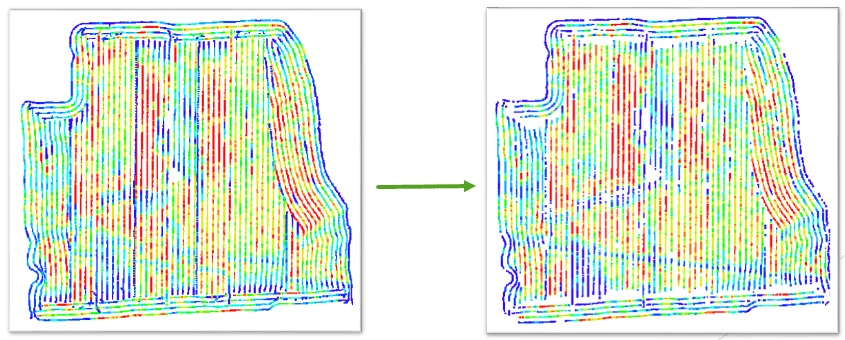
This week was very exciting! I continued working with R and several yield cleaning projects, but also got to join Greg for a couple of rounds of field work. This meant getting to see two of NMSP’s drones complete NDVI scans of corn fields. NDVI scans are able to measure the vigor of plants in the field, either to estimate yield or to help farmers more accurately place sidedress fertilizer. The latter seems very interesting but also very challenging. NDVI works on a scale of 0 to 1, with 1 being very green and 0 being not green at all.

Quantix drone

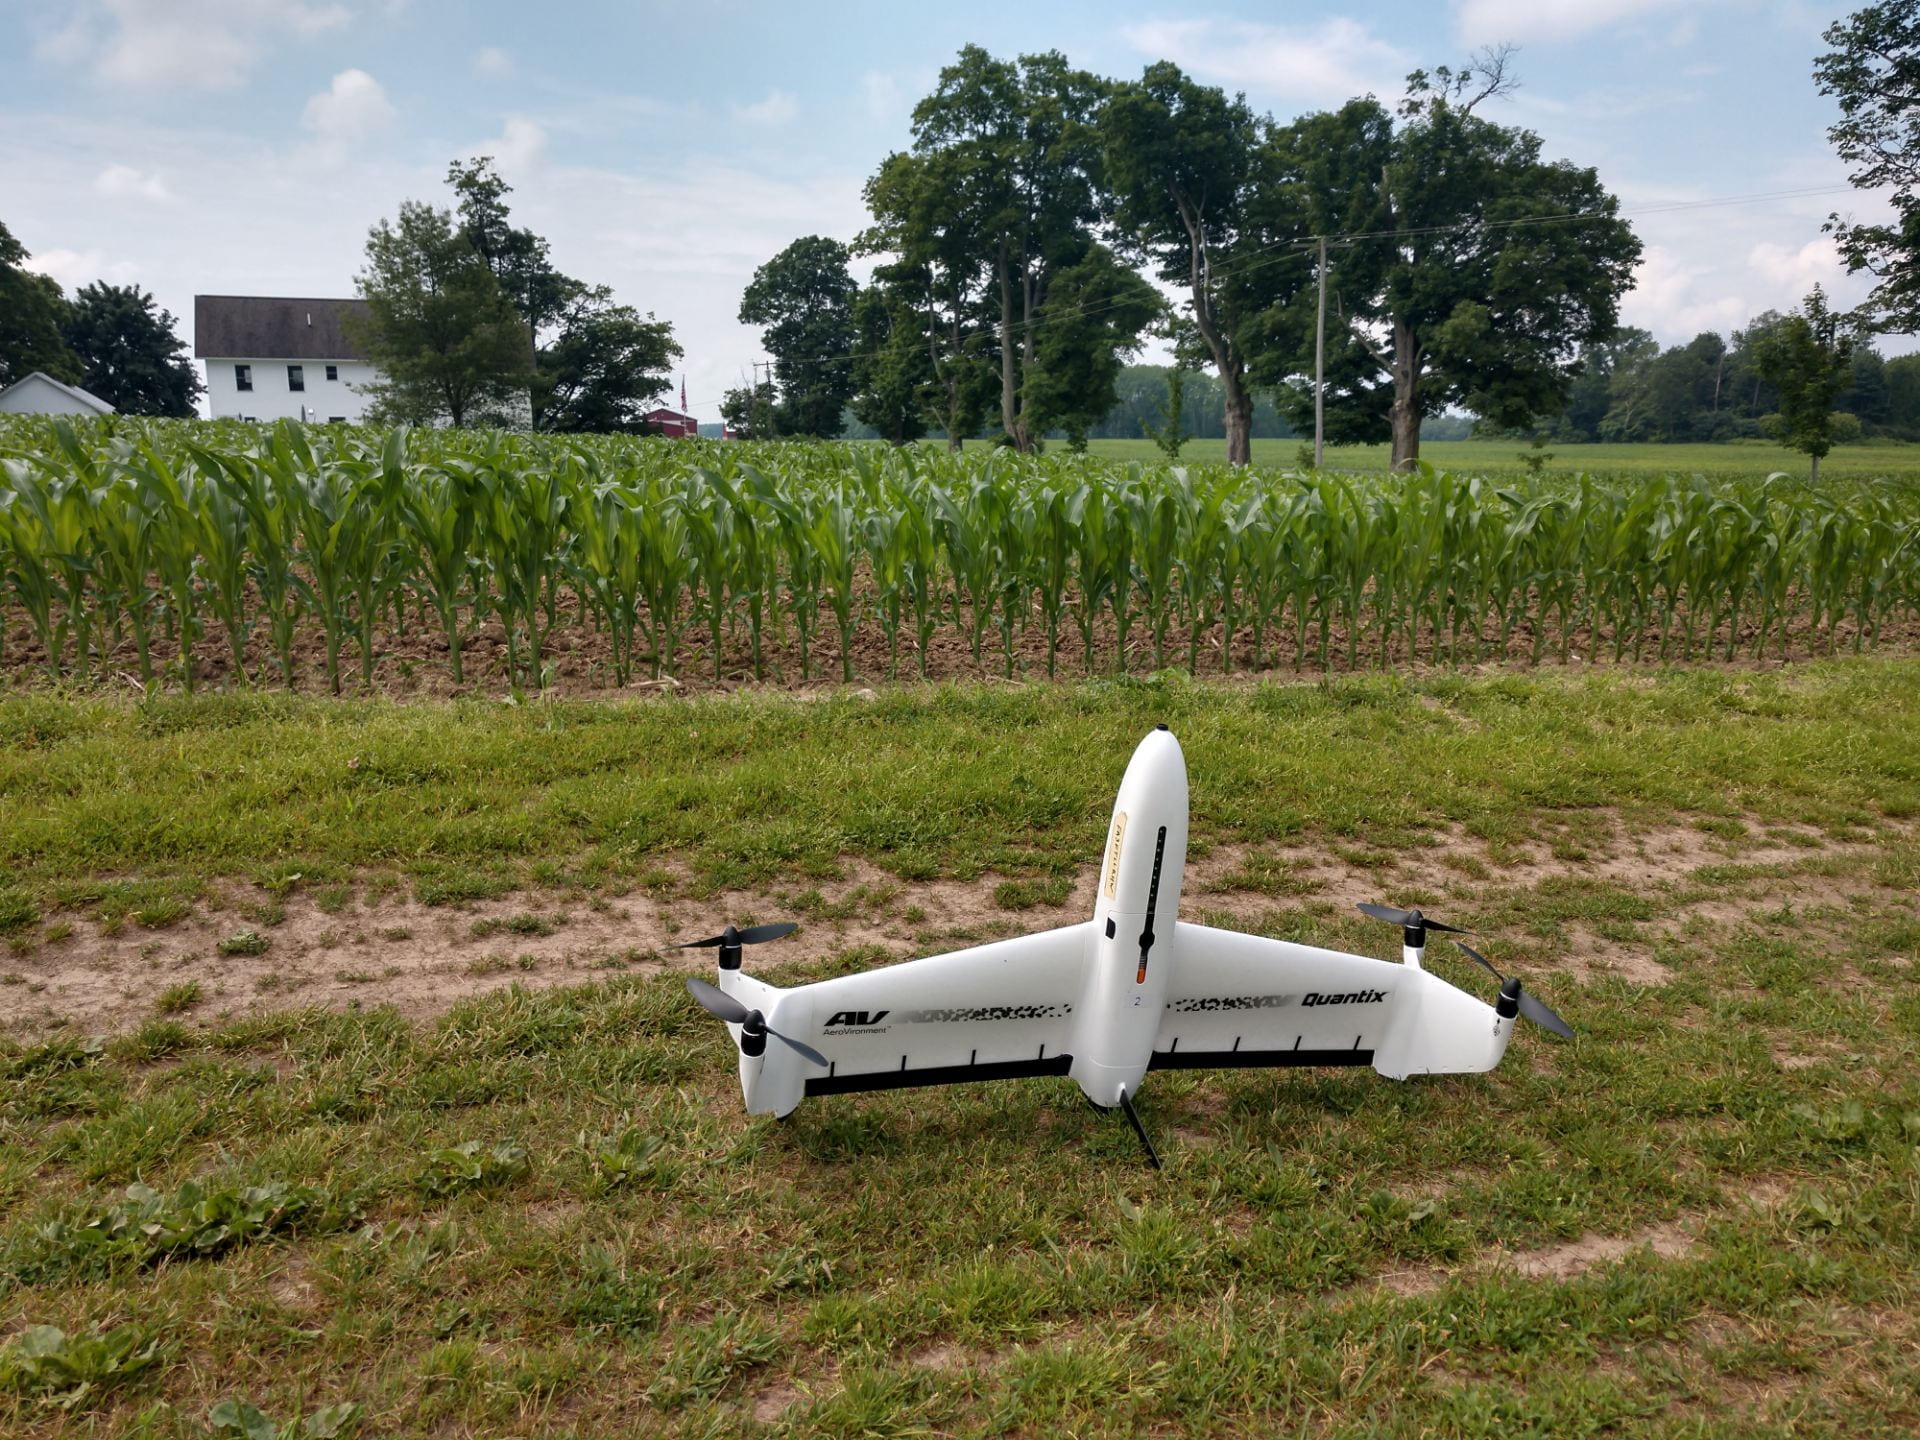
Drones are the quickest way for farmers to accurately take NDVI readings over a full field.


The greener sections of the field are assumed to not be nitrogen deficient, and the less green sections are given extra nitrogen to address lower vigor. However, lower vigor could also be due to other factors like a wet spot in the field or a deficiency of nutrients other than nitrogen. As precision ag technology continues to evolve, it will be cool to see how companies and farmers address these issues. Looking for patterns in individual leaves is one solution, but it would require very high resolution cameras and advanced imagery technology. I will be excited to learn more about this quickly moving ag sector as the summer goes on!

The Pirate Apples

Hey y’all, welcome back to the blog. This week, I want to write about an experiment that Megan and I worked on together. This experiment is called “Apple Adjuvant Russet 2019”. It has been nicknamed “AAR19” or “The Pirate Apples”.

AAR19 is a chemical experiment that involves making 2 sprays of Captan 80WDG at first and second cover, with various adjuvants to evaluate chemical injury in fruit set and lead phytotoxicity. The experiment is set up in three tree plots, with eight treatments and five replicates. Megan and I had to pick 30 fruit from each plot all around the green from waist to top-of-hand height. Additionally, we had to pick 30 leaves from the mid shoots and 30 leaves from spurs in each plot as well.

From there, we evaluated the fruits and the leaves. First, we manually visually rated the russeting on the fruit. Megan and I both did this so that we weren’t just relying on one person’s rating. We used a numeric scale to represent a range in percentages of russet. For example, if the apple had 0-20% russet, it was given a rating of one, and so on and so forth. Below, I will attach a picture of what I would give a one. Secondly, we looked at the leaves to count how many had damage from the sprays. This was done by both Megan and Edwin, one of the main research assistants in the horticulture department.

After, we took photos of the AAR19 apples to run through the digital image analysis program that I described in my last blog post. We had to take three photos of each set of apples: the stem bowl, the most russeted side, and 180 degrees from the most russeted side. Below, I will insert a photo of the set up we use to take photos. Because each set of apples slightly varies from one another, the thresholds of what to consider russet in the code of the program needed to be adjusted. This was a meticulous job because the three values needed to be accurate down to the hundredth decimal place. It took Megan and I almost a whole afternoon to agree on the correct numbers.

After this, we ran the pictures through the program and came up with percentages for each photo. We then entered them into a data sheet and Edwin ran them through some statistics. We found that because the p-value was so high, there was no significant difference between the different treatments.

In my next blog post, I want to talk about all of the odds and ends jobs that Megan and I do to maintain the orchards. Some of them were quite disgusting, while others were actually kind of fun!

Week Four: Fertilizer Trials

With the improved weather over the weekend, we were able to get into the field and place some stakes for nitrogen fertilizer trials this week! I attached a picture of the stakes below. They will be used as a reference for field treatments along with GPS coordinates to be taken at a later date. To place stakes, Greg and I followed a map indicating where each plot was located in the field. Plots have randomized locations over several trials in order to avoid environmental impacts from certain field sections influencing the final results.

Fertilizer stake and label

Top: Plot or treatment number
Middle: Pre-plant nitrogen treatment in pounds per acre
Bottom: Sidedress nitrogen treatment in pounds per acre


The trial features rye terminated at several different stages along with different volumes of both pre-plant and sidedress nitrogen fertilizer. Cover crops like these are important because they can improve soil health and increase soil organic matter, both of which provide a ton of value to New York State farmers. It was really cool to see the corn poking out from under the rye stubble, especially considering the difficult planting and field work conditions that farmers have faced this year.

Sweet & Cheeky!

Hi y’all, welcome back to the blog. These last couple of weeks at FREC, my fellow summer research assistant, Megan, and I have been focusing mainly on our project given to us by Dr. Schupp.

Our project focuses directly on a new club variety of apple called Sweet Cheeks. They are a cross between Honey Crisp and Pink Lady apples. Unfortunately, it has a fruit finish issue, mainly with russetting. This project will study which general sector of the tree has the most russet and which side of the apple it is prominently featured on.

The trees we were given to use are top worked trees, which mean the were planted as one variety, in this case, Gala, and then they were cut off where the rootstock and the scion join. Then, scions of the new variety (this is where the Sweet Cheeks come in) are placed in notches in trunk that is still in the ground. The scions are secured and left to grow.

We were given 5 of these trees, which we then divided into 6 sectors using flagging tape. Fist we divided the tree horizontally, determining an upper and lower canopy. This line was placed equidistant between the second and third wire of the trellis system. Second, we divided the tree into outer and inner canopy by dividing the tree vertically into three sections, creating an outer north, inner, and outer south.  If you’re lost (don’t worry, I was), refer to the picture below. With these divisions, we created 6 sectors of the tree. These sectors are: upper outer north, upper inner, upper outer south, lower outer north, lower inner, and lower outer south.

After this, Megan and I counted all of the apples in each sector. Then, we went through and counted the apples with signs of russet. We also rated whether the russeting was “low”, “moderate”, or “severe”. Russet usually initially appears as small black dots around the sides of the apple, typically on the exposed side that receives the most sun.

From there, we determined percent russeted in each sector. Just from this, we noticed that apples in the upper canopy had more russet because of their increased exposure to sun.

Additionally, to quantify severity, we harvested around a dozen apples from the surrounding sweet cheeks trees of which we considered “low” severity and around a dozen of which we considered “moderate” severity. We then took pictures of them and ran through a digital image analysis program that gives us a percentage of russet on the apple. To do this, one of the researchers there, Edwin, built a photo box using PVC pipe, poster board, and lamps. It has boards and pipes at the top, which can hold a camera that is used to capture the images. All you have to do is slide the apples in on the apple tray covered in blue fabric and click the capture button. I will insert a photo of the photo box. It is a picture taken from above because I was the one adjusting the camera.

We will survey the Sweet Cheeks again in August and at harvest time to determine whether the russet is early or late onset.

Next week, I hope to delve deeper into the other research projects that Dr. Schupp is working on and share with you how much I have learned!

Week Three: Extension and Communication

This week, several technicians from a NYS digital agriculture company came in for a yield cleaning training session. This was the first time that I have had a major role in a training session so I was a bit nervous. Using Yield Editor, I walked one technician through the initial settings selection process. There are 4 distinct settings used by Yield Editor to clean harvest maps. Flow delay (as pictured above) is caused by the gap in time between the actual harvest of the crop and the moment when the crop is massed by a sensor. Moisture delay is caused by a similar issue, and is especially important when cleaning silage data (as the moisture of silage is significantly higher and more variable than corn grain moisture). Start Pass Delay and End Pass Delay are both caused by the slowing down and speeding up of the harvester at the edge of the field, which often leads to unreliable yield data.

This is an image pulled from a PowerPoint presentation that I created to help farm consultants learn the data cleaning process. As more and more farms in New York State get yield monitors on their corn harvesters, it will become increasingly important for consultants to feel confident working with that data.

This is an image pulled from a PowerPoint presentation that I created to help farm consultants learn the data cleaning process. As more and more farms in New York State get yield monitors on their corn harvesters, it will become increasingly important for consultants to feel confident working with that data.


By using both the Automated Yield Cleaning Expert (a Yield Editor feature that estimates the proper delay settings) and a more guess-and-check method, yield cleaning technicians are able to determine the proper initial settings after manually examining only 10 fields from each farm annually. After finding the proper settings for the farm, technicians are able to use low-level programming to automatically clean the harvest data from the remaining fields. This saves farmers a lot of time working with data and still provides the high level of accuracy needed for yield estimation.

Week Two: Intro to R

This week, I spent a couple of days working with Dilip to learn the process for creating farm reports from yield data sets. This is the way that NMSP shows farmers what the program does with donated harvest data and makes it easier to understand the impact of the data cleaning process. Using RStudio (pictured below) and the R programming language, I am now able to take cleaned yield data files from Yield Editor and quickly create graphs that illustrate which parts of the field contained the best data and which sections had to be removed (commonly called headlands). The reports also contain several interesting pieces of analysis. The average yield for each soil type in each field is listed on one page, with the average yield for each soil type across the whole farm listed later in the report. This information helps farmers to better understand why certain fields are high yielding and other fields continually underperform compared to the whole farm average.

Example of R code

This is an example of R code. I also went to a free R coding workshop put on by the Cornell Statistical Consulting Unit this week which was very helpful. There are a lot of good resources to start learning R, but practice is key!

Just in Time for Alfalfa Cutting

Just in time for Alfalfa Cutting
June 12th

Hi everyone!  I have joined the Osterhoudt team just in time for their second cutting of Alfalfa hay. Alfalfa is very rich and nutritious and high in protein which makes it an important feed for dairy cows, especially the ones actively producing milk.

Here’s a run-down of an alfalfa hay silage harvest: the standing hay is mowed and left to dry-down to an acceptable percentage moisture. A measure of around 40-45% dry matter (or 55-60% moisture) is reached, then the hay is merged, or raked, into windrows to be fed through the chopper.

(Because Osterhoudt Farms is a Custom Harvesting operation, they harvest fields all over the county. Above is a picture I took of the mergers raking on a beautiful hillside field with a view of Cayuga Lake.)

The chopper uses a giant fan to blow the finely cut hay up the chute and into the trucks. I rode with Walt, the chopper operator, and he even let me try my hand at it!

The trucks haul the haylage to the dairy farm bunk, where it is mounded and packed. The pack is important firstly to keep the product contained, and secondly to compress the hay together to rid the bunk of excess oxygen so it can ferment properly. For silage to ferment without producing a rancid or noxious acid, the microorganisms that perform the fermentation process require an anaerobic environment.

Before sending the choppers out, determining if the hay was at the appropriate moisture content was critical. Because silage is meant to be fermented, a much higher moisture content is acceptable than would be in bales of dry hay. This is an advantage for some farmers because the haylage process allows more days of possible harvest as many consecutive sunny days aren’t needed to dry out the hay. However, it is still important that even in haylage the moisture content is around or just below 60%, so the hay is sampled and tested before harvesting. The farm still checks the moisture through the old tried and true “cooking” method: drying a sample in the oven and measuring water component by difference in weight, but we also had a new moisture sensor that is being tested for use in New York by the Dairy One research lab. Dairy One loaned one of their portable devices to gauge its accuracy and gain information for their database.

And we will get to repeat this whole process a few more times this year! Alfalfa is cut 3 or 4 times per season depending on the weather. ‘Till next time!


So Much FRECin’ Fruit

Hey y’all, my name’s Bethany and I will be a junior this fall. I am from Biglerville, Pennsylvania and I have a background in fruit trees, but specifically apples. This summer I am an intern at FREC, Penn State Extension’s Fruit Research and Extension Center, conveniently located also in Biglerville, PA. At FREC, there are 5 lead scientists, each conducting research on horticulture, plant pathology, agricultural engineering, or entomology. I am working as an intern for Dr. Schupp, the horticulturalist there. He works specifically with apples, pears, and peaches, but mainly with apples because they are popular in the surrounding area. Within apples, I noticed that he has mainly been working with different types of thinning, pruning, and tree training to produce the most amount of apples. Additionally, he is also working on some interesting projects with the agricultural engineers for automated pruning and picking.

I spend most of my days outside, tending to the trees or modifying them to the produce the desired result. Recently, I have been thinning and pruning a lot of peach trees, thinning apple trees to define a strong terminal bud, and clipping up the recently planted Ever Crisp and Premiere Honey Crisp apples.


Pictured above is the NBlosi, a scissor lift with a shifting platform that allows us to easily reach into the trees. On the right are the Gala apple trees that we trained.

Further, I have also become fascinated by the different bugs around the orchard; I usually take a picture of them and show them to the entomology interns during lunch. I’ll post some of my favorites below:

Pictured above on the left is a leather wing, also known as a soldier beetle. In the middle is a common leaf beetle that caught be by surprise. On the right is a praying mantis nest that I found pruning.

Every year, Dr. Schupp hands his summer interns their own project to take charge of. This year, we get to run a project that deals with a new club variety of apple called Sweet Cheeks. However, it has many fruit finish issues. Our job is to determine whether the russetting is early or late onset and suggest ways to prevent it. I am excited to explain about it more in my next post!

Week One: Yield Editor

My first week was a bit of a rush! I started out using Yield Editor (a free software published by USDA-ARS) to clean corn data from a farm that works with NMSP on a couple of projects. Cleaning harvest data is important because it allows farmers to know exactly how much they are able to produce in certain fields. It is also important to have very accurate data for making decisions about which fertilizers to use and how much of each nutrient to apply in different sections of the farm.

Example of flow delay correction in Yield Editor

Left: Raw corn harvest data. Right: Data cleaned following the Kharel et al. protocol


Data technicians at NMSP follow the yield cleaning protocol written by Dr. Tulsi Kharel, one of my supervisors at the lab. The manual is very helpful because it’s easy to forget steps in the yield data cleaning process if you are just working from memory. Following the protocol also ensures that data sets cleaned by different technicians will still be consistent and highly accurate. Tulsi is leaving for a position with the USDA in Arkansas soon which will be sad but he has already taught me a lot about working with agronomic data. Dilip, the lead data analyst in the lab, has also been very generous with his time and has started to teach me how to use the programming language R. This will hopefully allow me to start creating farm reports based off of the cleaned yield data, which would be a new and exciting skill!

Applied Precision Ag – Data that Works for Farmers

Ben Lehman – CCE 2019 Precision Ag Intern

Hi, my name is Ben! I’m a rising junior in Agricultural Sciences at Cornell. This summer I ‘ll be keeping a blog of my experience interning with the Nutrient Management Spear Program (NMSP). Dr. Quirine Ketterings leads the lab and has already assigned a few cool new projects for me to work on this summer! A lot of my work will be processing corn harvest data, using AgLeader SMS for pre-processing, Yield Editor for correcting errors and delays in yield data, and RStudio to create reports and graphs for farmers. I’ll also be doing some field work and getting a better understanding of the lab’s mission as a whole.


Skip to toolbar