Organic Cropping Systems (OCS) is a study comparing four different organic cropping systems. The four different systems are a high fertility system, low fertility system, enhanced weed management system, and reduced tillage system. The experiment is headed by several people. The head person in our lab is Brian Caldwell. All the work that I have done has been on a sub-experiment within the OCS experiment. This experiment is run by Margaret Ball, one of the grad students in our lab. From this point when I mention OCS, I will be talking about Margaret’s sub-experiment. Margaret’s experiment compares weed suppression, weed community composition, weed-crop competition and effect of nutrient addition among soybean in all four systems.
Weeds are a major problem for organic growers since organic systems exclude the use of conventional herbicides. By exploring these four organic cropping systems Margaret can examine which system is best at managing the effects of weed competition or which systems that are more conducive for soybean resilience For example, last year the experiment saw results that suggested the low fertility system was most favorable for soybeans because of competitive yield, good weed suppression, and low input costs.

Picture of a system plot. For example 1.1A, 1.1B, 1.3B, etc. (refer to map)
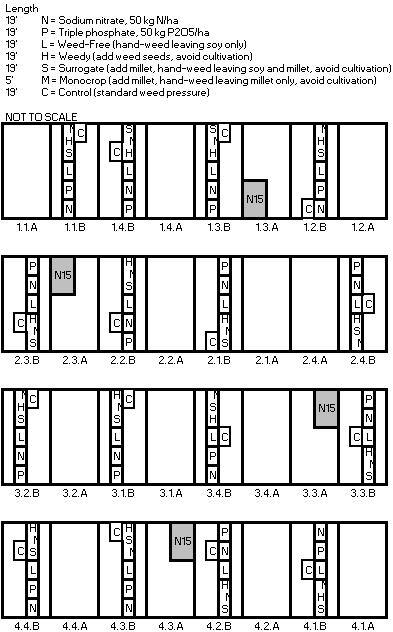
Picture of a plot map and treatments. Each rectangle represents a system plot. Each little rectangle within the system plot represents a subplot with a specific treatment.
The OCS experiment is where my work has been the most diverse. Here is a list of what I have worked on so far:
1)We first measured out where the soybeans were going to be planted in the experiment.
2) The individual treatments(subplots) needed to be measured out. Soybean rows had already been planted and were starting to emerge from the soil. In all there were six treatments (excluding the control treatment). The six treatments were:
- Sodium nitrate application
- Triple Phosphate application
- Weed-free (hand-weed leaving soybeans only)
- Weedy (add weed seeds and avoid cultivation)
- Surrogate (add millet, hand-weed leaving soybean and millet, and avoid cultivation)
- Monocrop (add millet, hand-weed leaving millet only, and avoid cultivation)
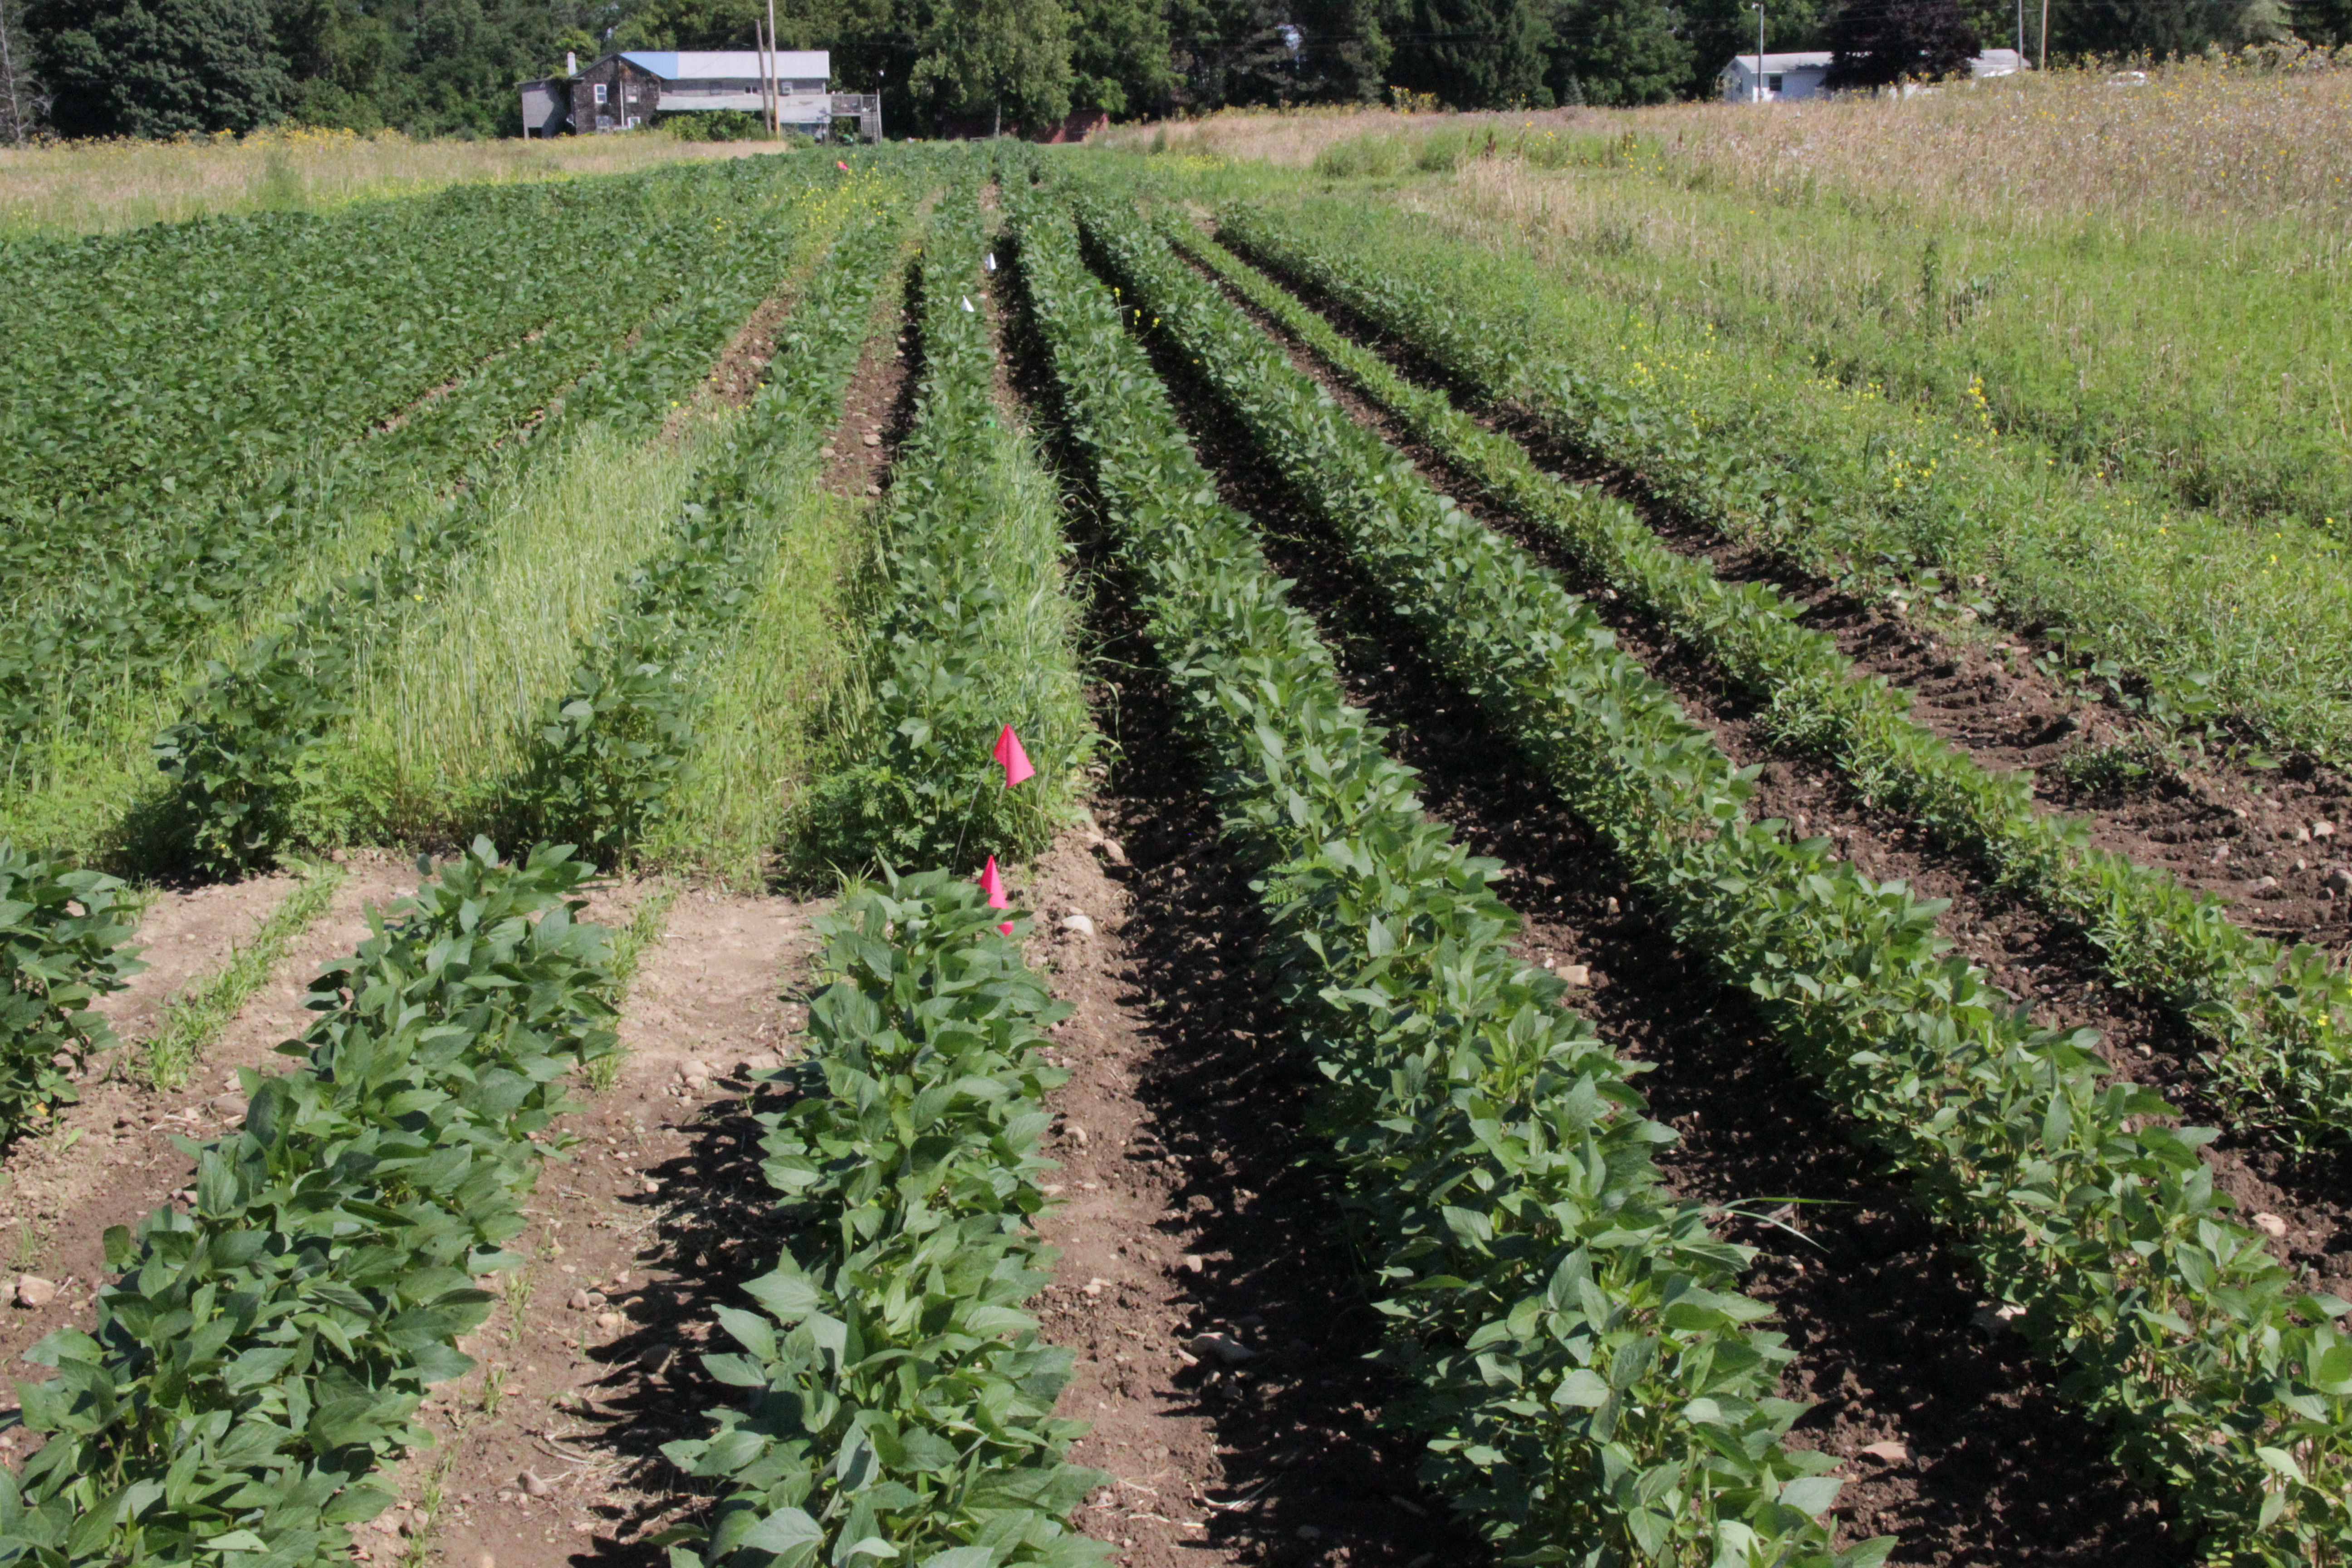
Example of the differences among subplots. At the bottom left corner is the Surrogate subplot, next is the Monocrop subplot, then the Weedy subplot, and lastly the Weed free plot.
3)After the treatment plots had been measured out we broadcasted the millet seed, weed seed, and fertilizers. The Millet plots were designed to create consistent competitive pressure for the soybeans between all systems. The weed seed was planted to show the effect of having a high density of weeds.
4)Soil samples were taken from plots to compare the soil properties among each system.
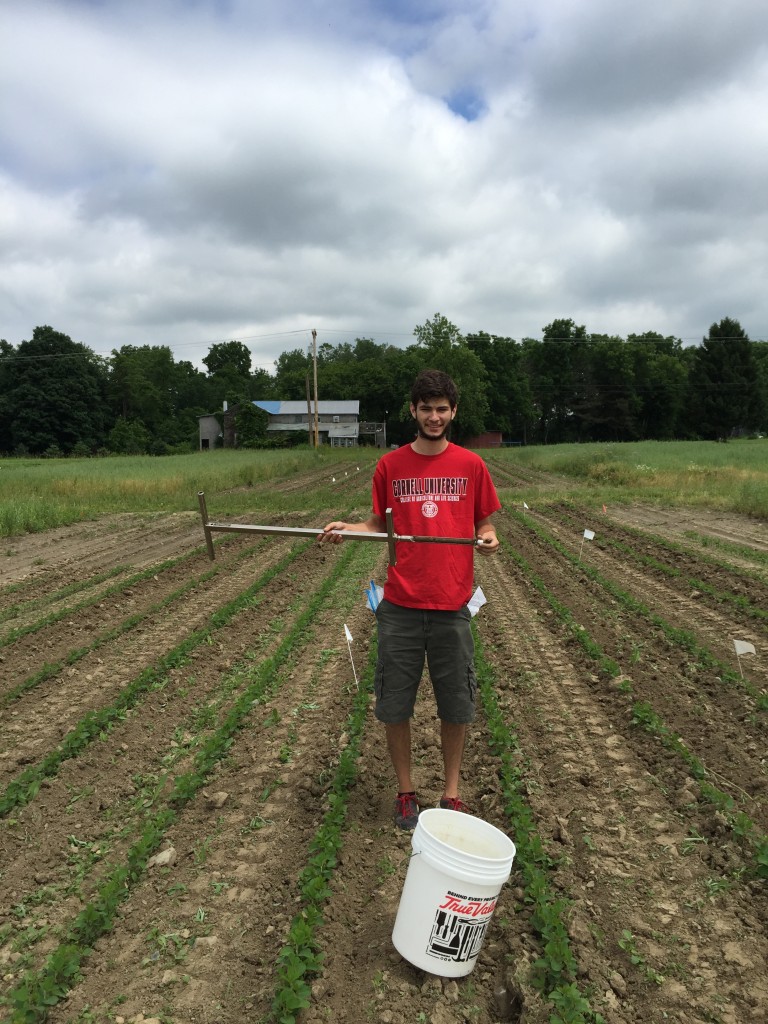
Taking soil samples.
5) Due to improper germination, millet had to be replanted. When we replanted millet we planted it in rows instead of broadcasting because it makes it easier to differentiate between millet and other grasses like Foxtail.
6) Weekly weeding of weed free plots.
7) Lastly, we took weed and soybean biomass samples. In my first post I talked about biomass sampling. The process was very similar in this experiment. Within the quadrat we identified and counted the weed species and counted how many soybeans were present.