One of my own personal projects for the summer includes doing planter analyses and sharing my results with farmers. When I say “planter analyses,” what I mean is calculating data in the field in order to reduce planter performance effects on corn yield. This post may be for the more agricultural machinery/agronomic savvy folks, but I still encourage all to read along! My apologies for the excessive length! 🙂
Farmers ask a lot out of their planter, and even minor planter wear can cause seed depth and distance placement variability to increase; potentially impacting yield (1).
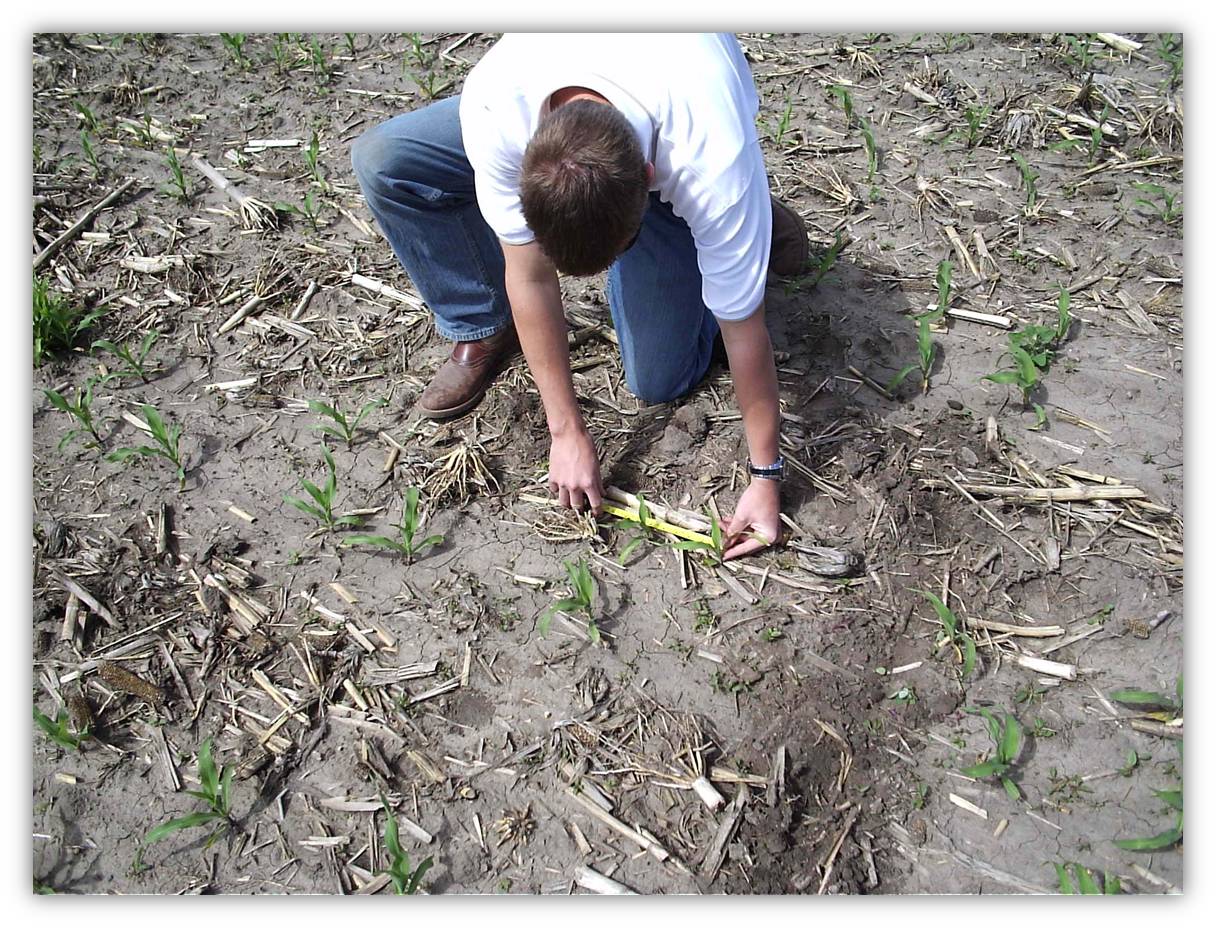
By counting space between corn plants in a row, we can determine how consistent the planter is at placing a seed into the ground. Knowing this, we can determine plant population and how many bushels may be lost in each row due to inconsistent seed placement. Of course, it is much easier said than done.
Going out to the field and gathering the data to get started can often end up being quite an investigation. When you get to the field, first you have to determine which direction the farmer was planting in order to accurately determine which row in the field corresponds with the specific row unit on the planter. To do this you, must look for clues like tire tracks (which can be tricky when there are multiple tracks through the field; like from a sprayer). Often where the rows meet the headlands, you can tell when the farmer pulled the planter unit up and sat it back down. Usually the planter gets put down slightly earlier on the way into the field than out.
Next, it is important to get to a spot in the field that will generally be a sufficient sample of the entire field. Some university studies recommend gathering data from two different locations in the field to get a good sample, but we have found that generally one sample is good enough if you are not picking the best or worst-looking-spot in the field.
By measuring the space between 20 plants in each row of the planter, (which yes, this means a lot more work when the farmer has a 32 row planter rather than a 12 row planter) we can calculate standard deviation, plant population, average plant spacing, and bushels lost. Studies have determined that two standard deviations from the mean is the best a farmer can expect to get. This often has to do with the fact that germination rate is never going to be 100 percent, but rather 90-95 percent. So if the average plant spacing is 7 inches, any plant spacing of 5 to 9 inches means that we can account for zero bushels lost. When you go over two standard deviations, studies show between 2.5 and 4.5 bushels lost for every additional inch. We calculate 4 bushels lost for every additional inch over two standard deviations.
After entering all the data into a spreadsheet, each producer can see which rows on their planter have the most variance in plant spacing and how many bushels it may be costing them. If a certain row is significantly high, resulting in a high yield loss, it may be necessary to go back to the field and check again. If upon a second examination of the row, the specific row on the planter may need to be looked at for mechanical error. Not only does the producer get to see the results of their planter, but the farmer can compare them to the results of other anonymous producers’ planters done throughout previous years. Planters are also organized by make, for easy comparison between brands. If you are a John Deer person, you would be happy to know those are the planters that have generally been our top performers.
We do planter analyses generally for new seed customers, clients with new planters, or for those who might be considering buying a new one, and also prospective clients. Every farmer I have shown our results to enjoys seeing how they compare to others, and is grateful that we do this, because after all, MaxYield prides itself on being a solutions provider, not just a provider of stuff. If you are interested, I’ve also attached a couple of links to university articles dealing with the subject.
(2) Estimating Corn Yield Losses From Unevenly Spaced Planting
Great article Geoff.
My intern this year was researching this subject and found yours.
Thanks Dan. Hope all is well!
I’m headed back to Cornell this fall for my master’s in agronomy.
So, did your intern find a way to analyze stand counts with variable rate population?? 🙂